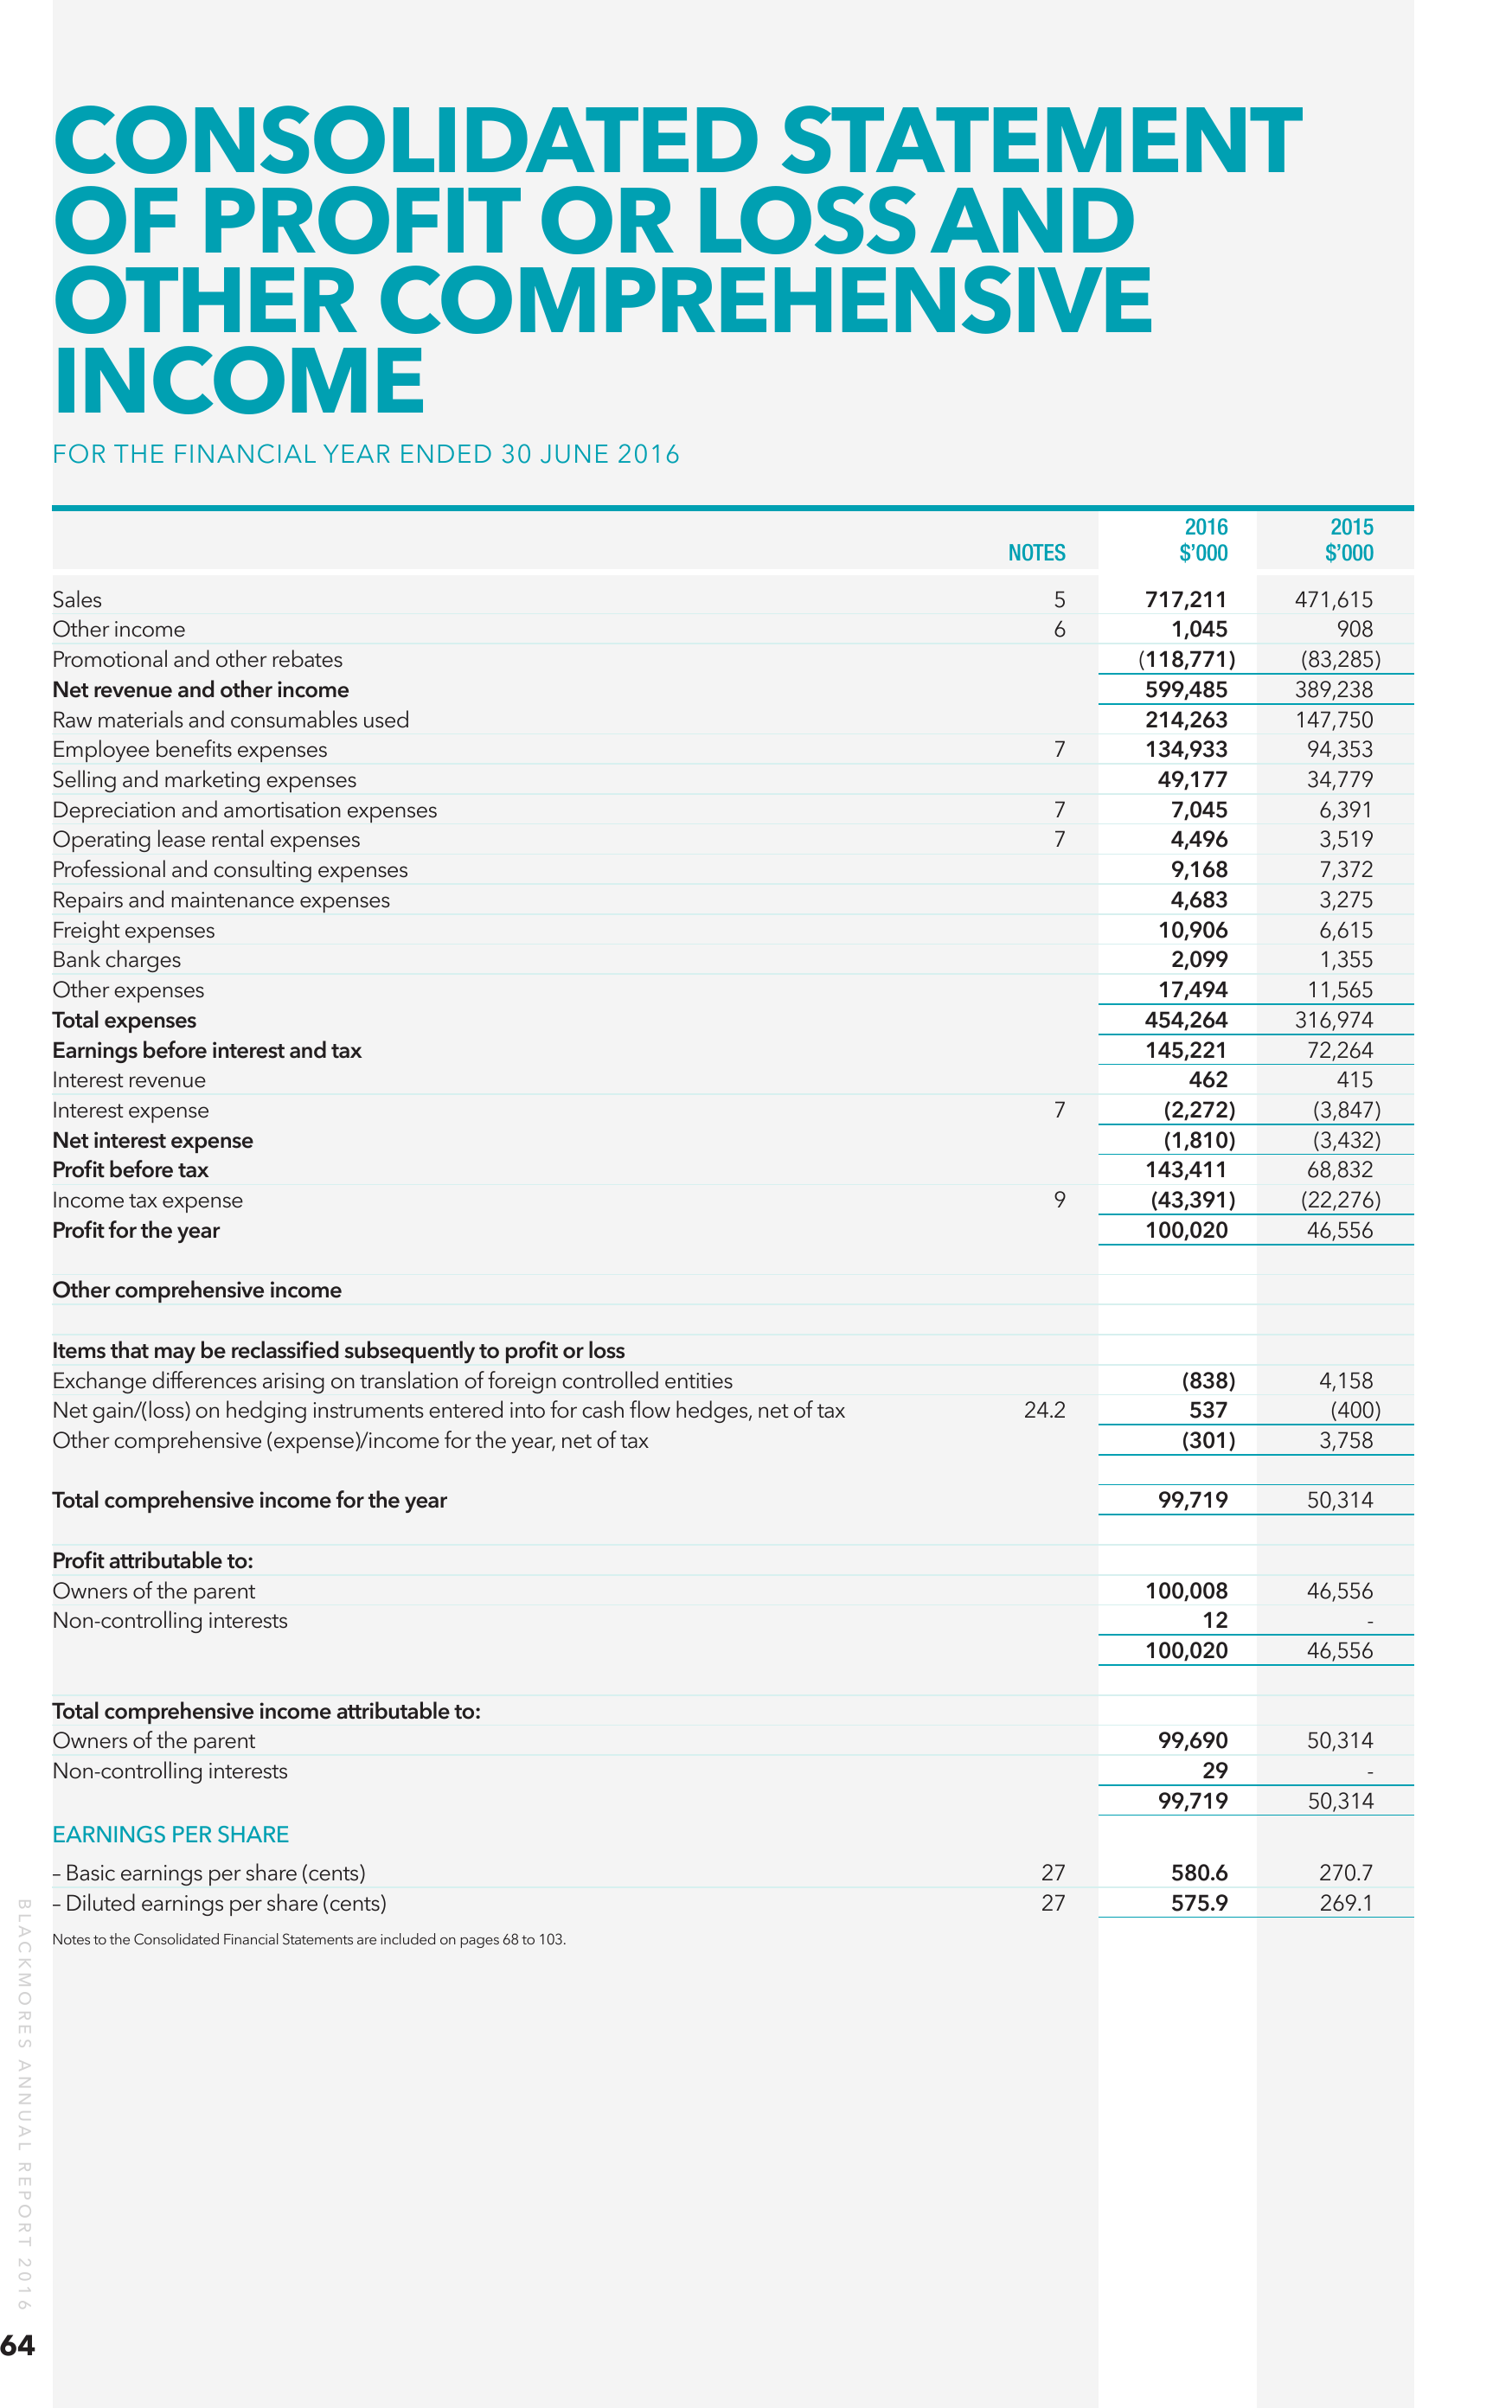
CONSOLIDATED STATEMENT
OF PROFIT OR LOSS AND
OTHER COMPREHENSIVE
INCOME
FOR THE FINANCIAL YEAR ENDED 30 JUNE 2016
2016 2015
NOTES
$’000
$’000
Sales 5
717,211
471,615
Other income
6
1,045
908
Promotional and other rebates
(118,771)
(83,285)
Net revenue and other income
599,485
389,238
Raw materials and consumables used
214,263
147,750
Employee benefits expenses
7
134,933
94,353
Selling and marketing expenses
49,177
34,779
Depreciation and amortisation expenses
7
7,045
6,391
Operating lease rental expenses
7
4,496
3,519
Professional and consulting expenses
9,168
7,372
Repairs and maintenance expenses
4,683
3,275
Freight expenses
10,906
6,615
Bank charges
2,099
1,355
Other expenses
17,494
11,565
Total expenses
454,264
316,974
Earnings before interest and tax
145,221
72,264
Interest revenue
462
415
Interest expense
7
(2,272)
(3,847)
Net interest expense
(1,810)
(3,432)
Profit before tax
143,411
68,832
Income tax expense
9
(43,391)
(22,276)
Profit for the year
100,020
46,556
Other comprehensive income
Items that may be reclassified subsequently to profit or loss
Exchange differences arising on translation of foreign controlled entities
(838)
4,158
Net gain/(loss) on hedging instruments entered into for cash flow hedges, net of tax
24.2
537
(400)
Other comprehensive (expense)/income for the year, net of tax
(301)
3,758
Total comprehensive income for the year
99,719
50,314
Profit attributable to:
Owners of the parent
100,008
Non-controlling interests
12
100,020
46,556
46,556
Total comprehensive income attributable to:
Owners of the parent
99,690
50,314
Non-controlling interests
29
99,719
50,314
EARNINGS PER SHARE
BLACKMORES ANNUAL REPORT 2016
64
– Basic earnings per share (cents)
– Diluted earnings per share (cents)
Notes to the Consolidated Financial Statements are included on pages 68 to 103.
27
27
580.6
575.9
270.7
269.1