OPERATING + FINANCIAL REVIEW
BLACKMORES ANNUAL REPORT 2016
BLACKMORES ANNUAL REPORT 2016
18
18
%%
60 60
50 50
40 40
30 30
20 20
10 10
0 0
12 12
13 13
14 14
15 15
16 16
%%
120
120
100
100
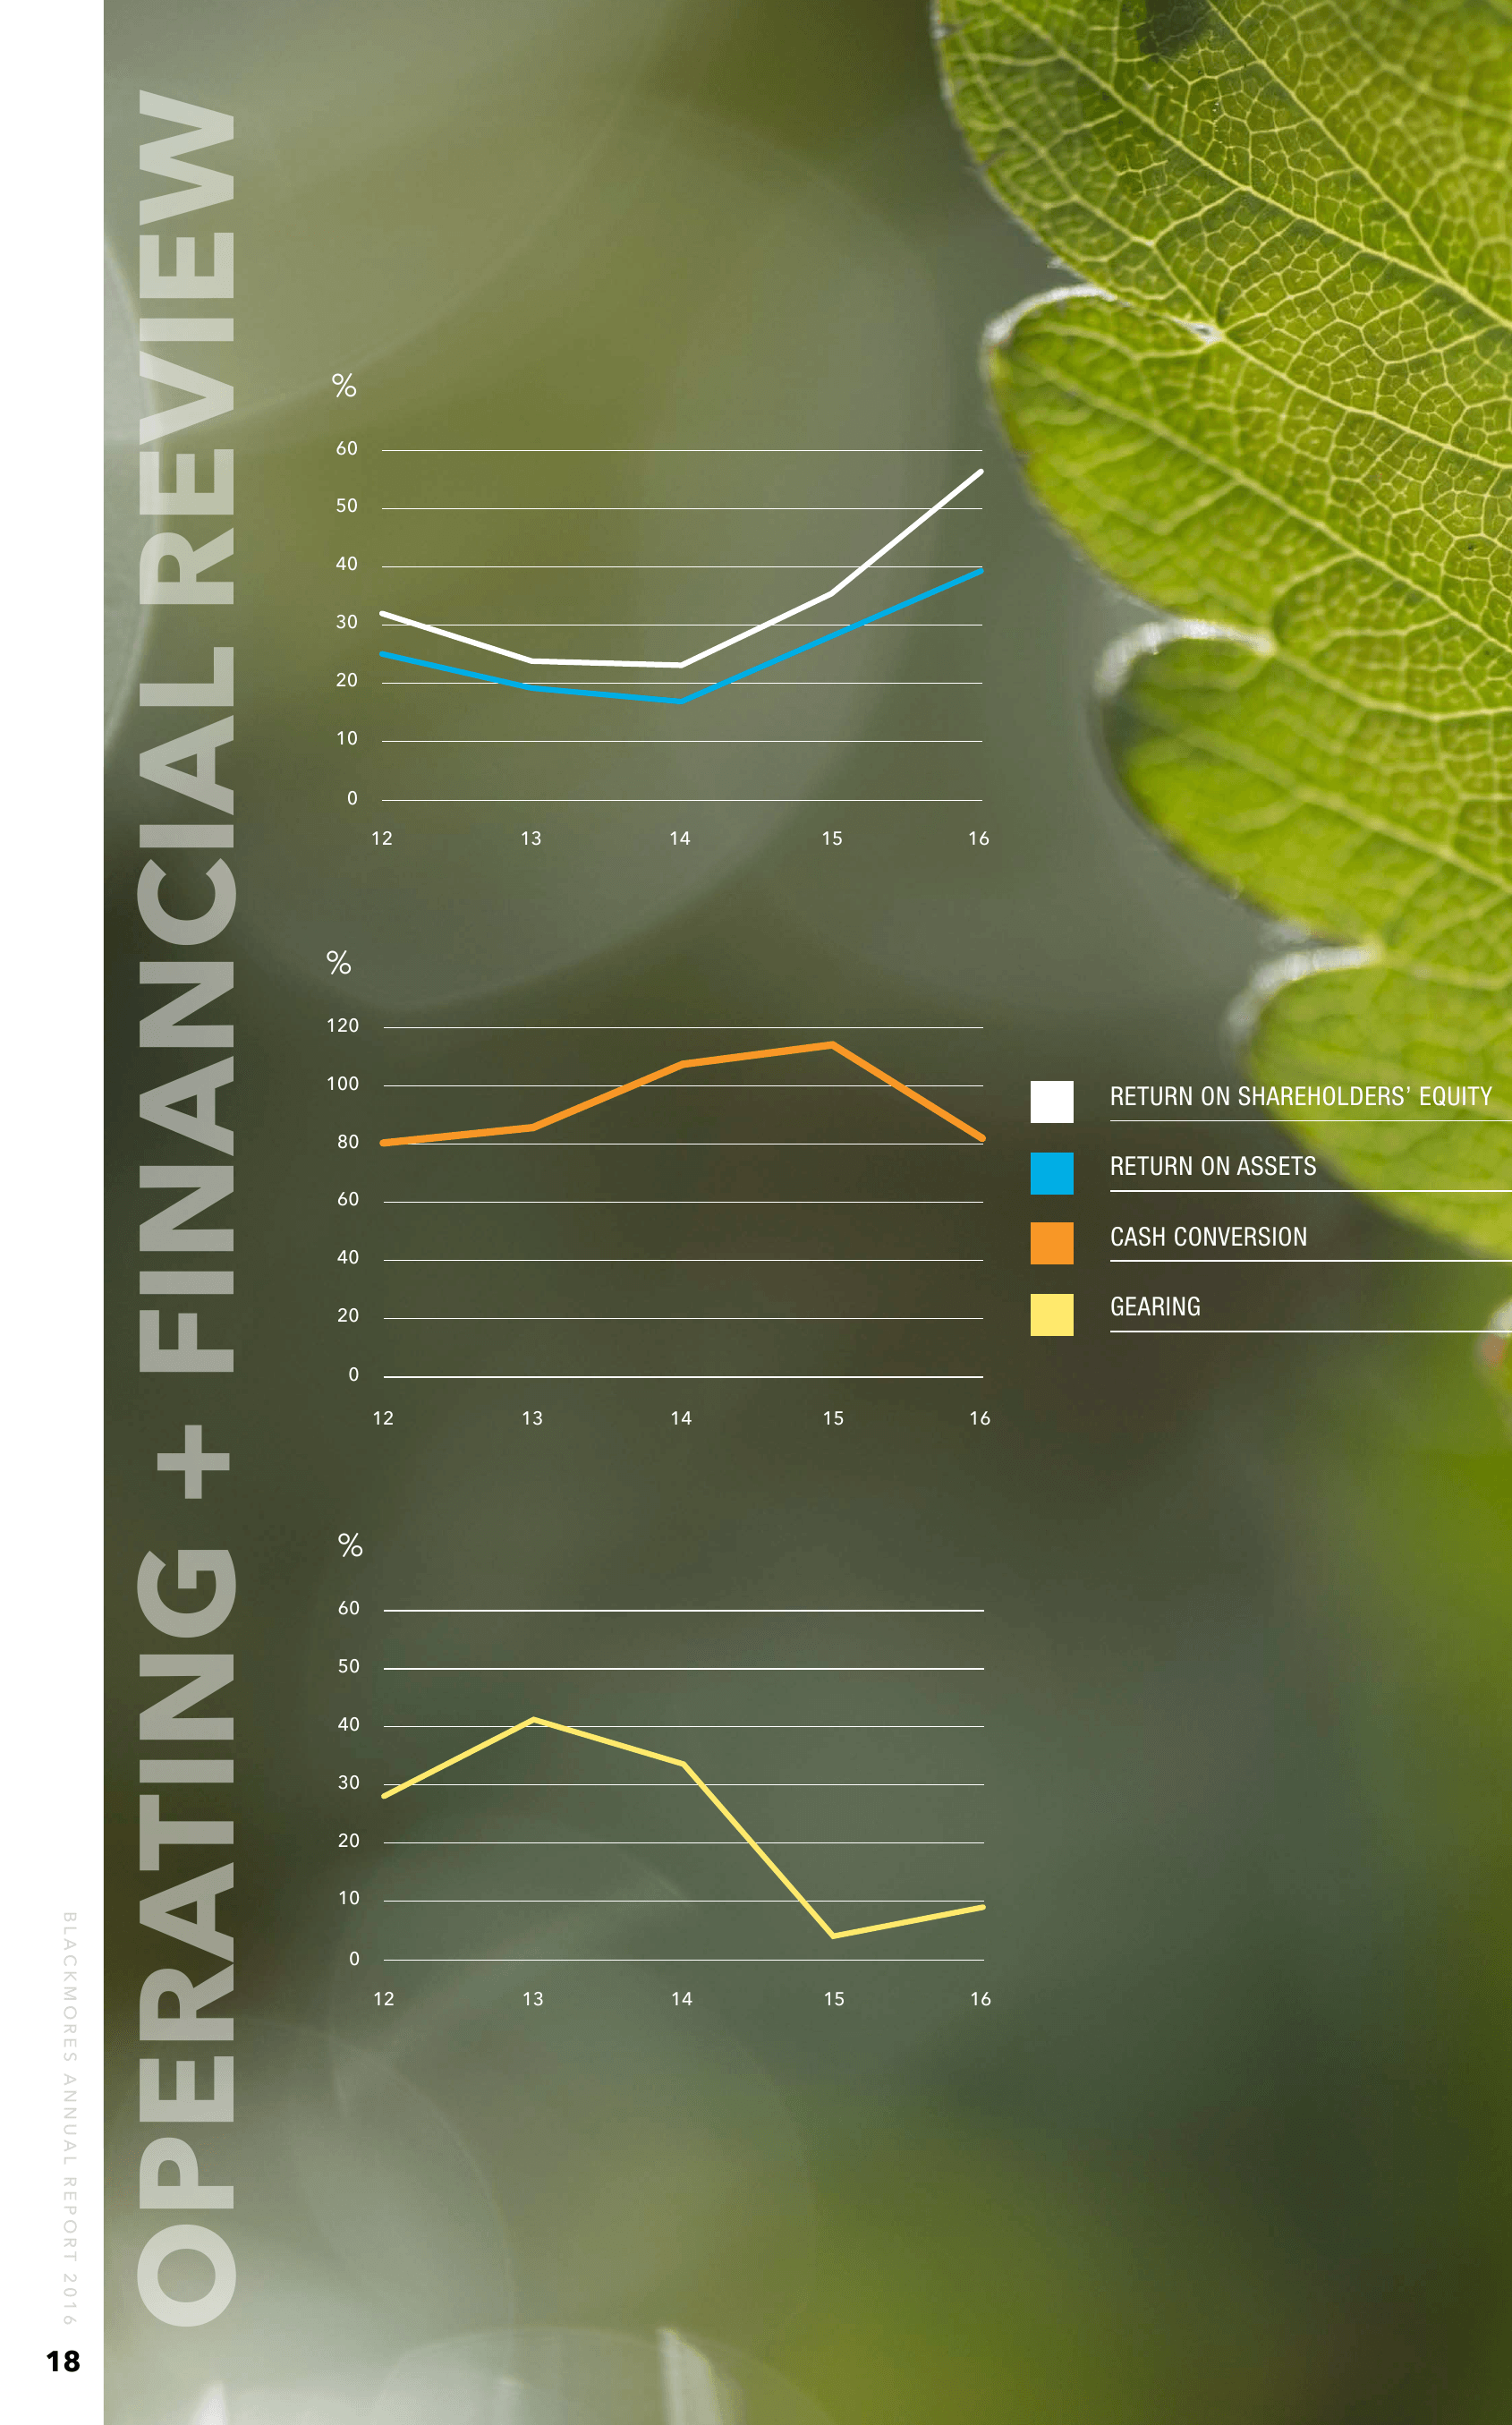
RETURN ONON SHAREHOLDERS’ EQUITY
RETURN SHAREHOLDERS’ EQUITY
80 80
RETURN ONON ASSETS
RETURN ASSETS
60 60
CASH CONVERSION
CASH CONVERSION
40 40
GEARING
GEARING
20 20
0 0
12 12
13 13
14 14
15 15
16 16
13 13
14 14
15 15
16 16
%%
60 60
50 50
40 40
30 30
20 20
10 10
0 0
12 12
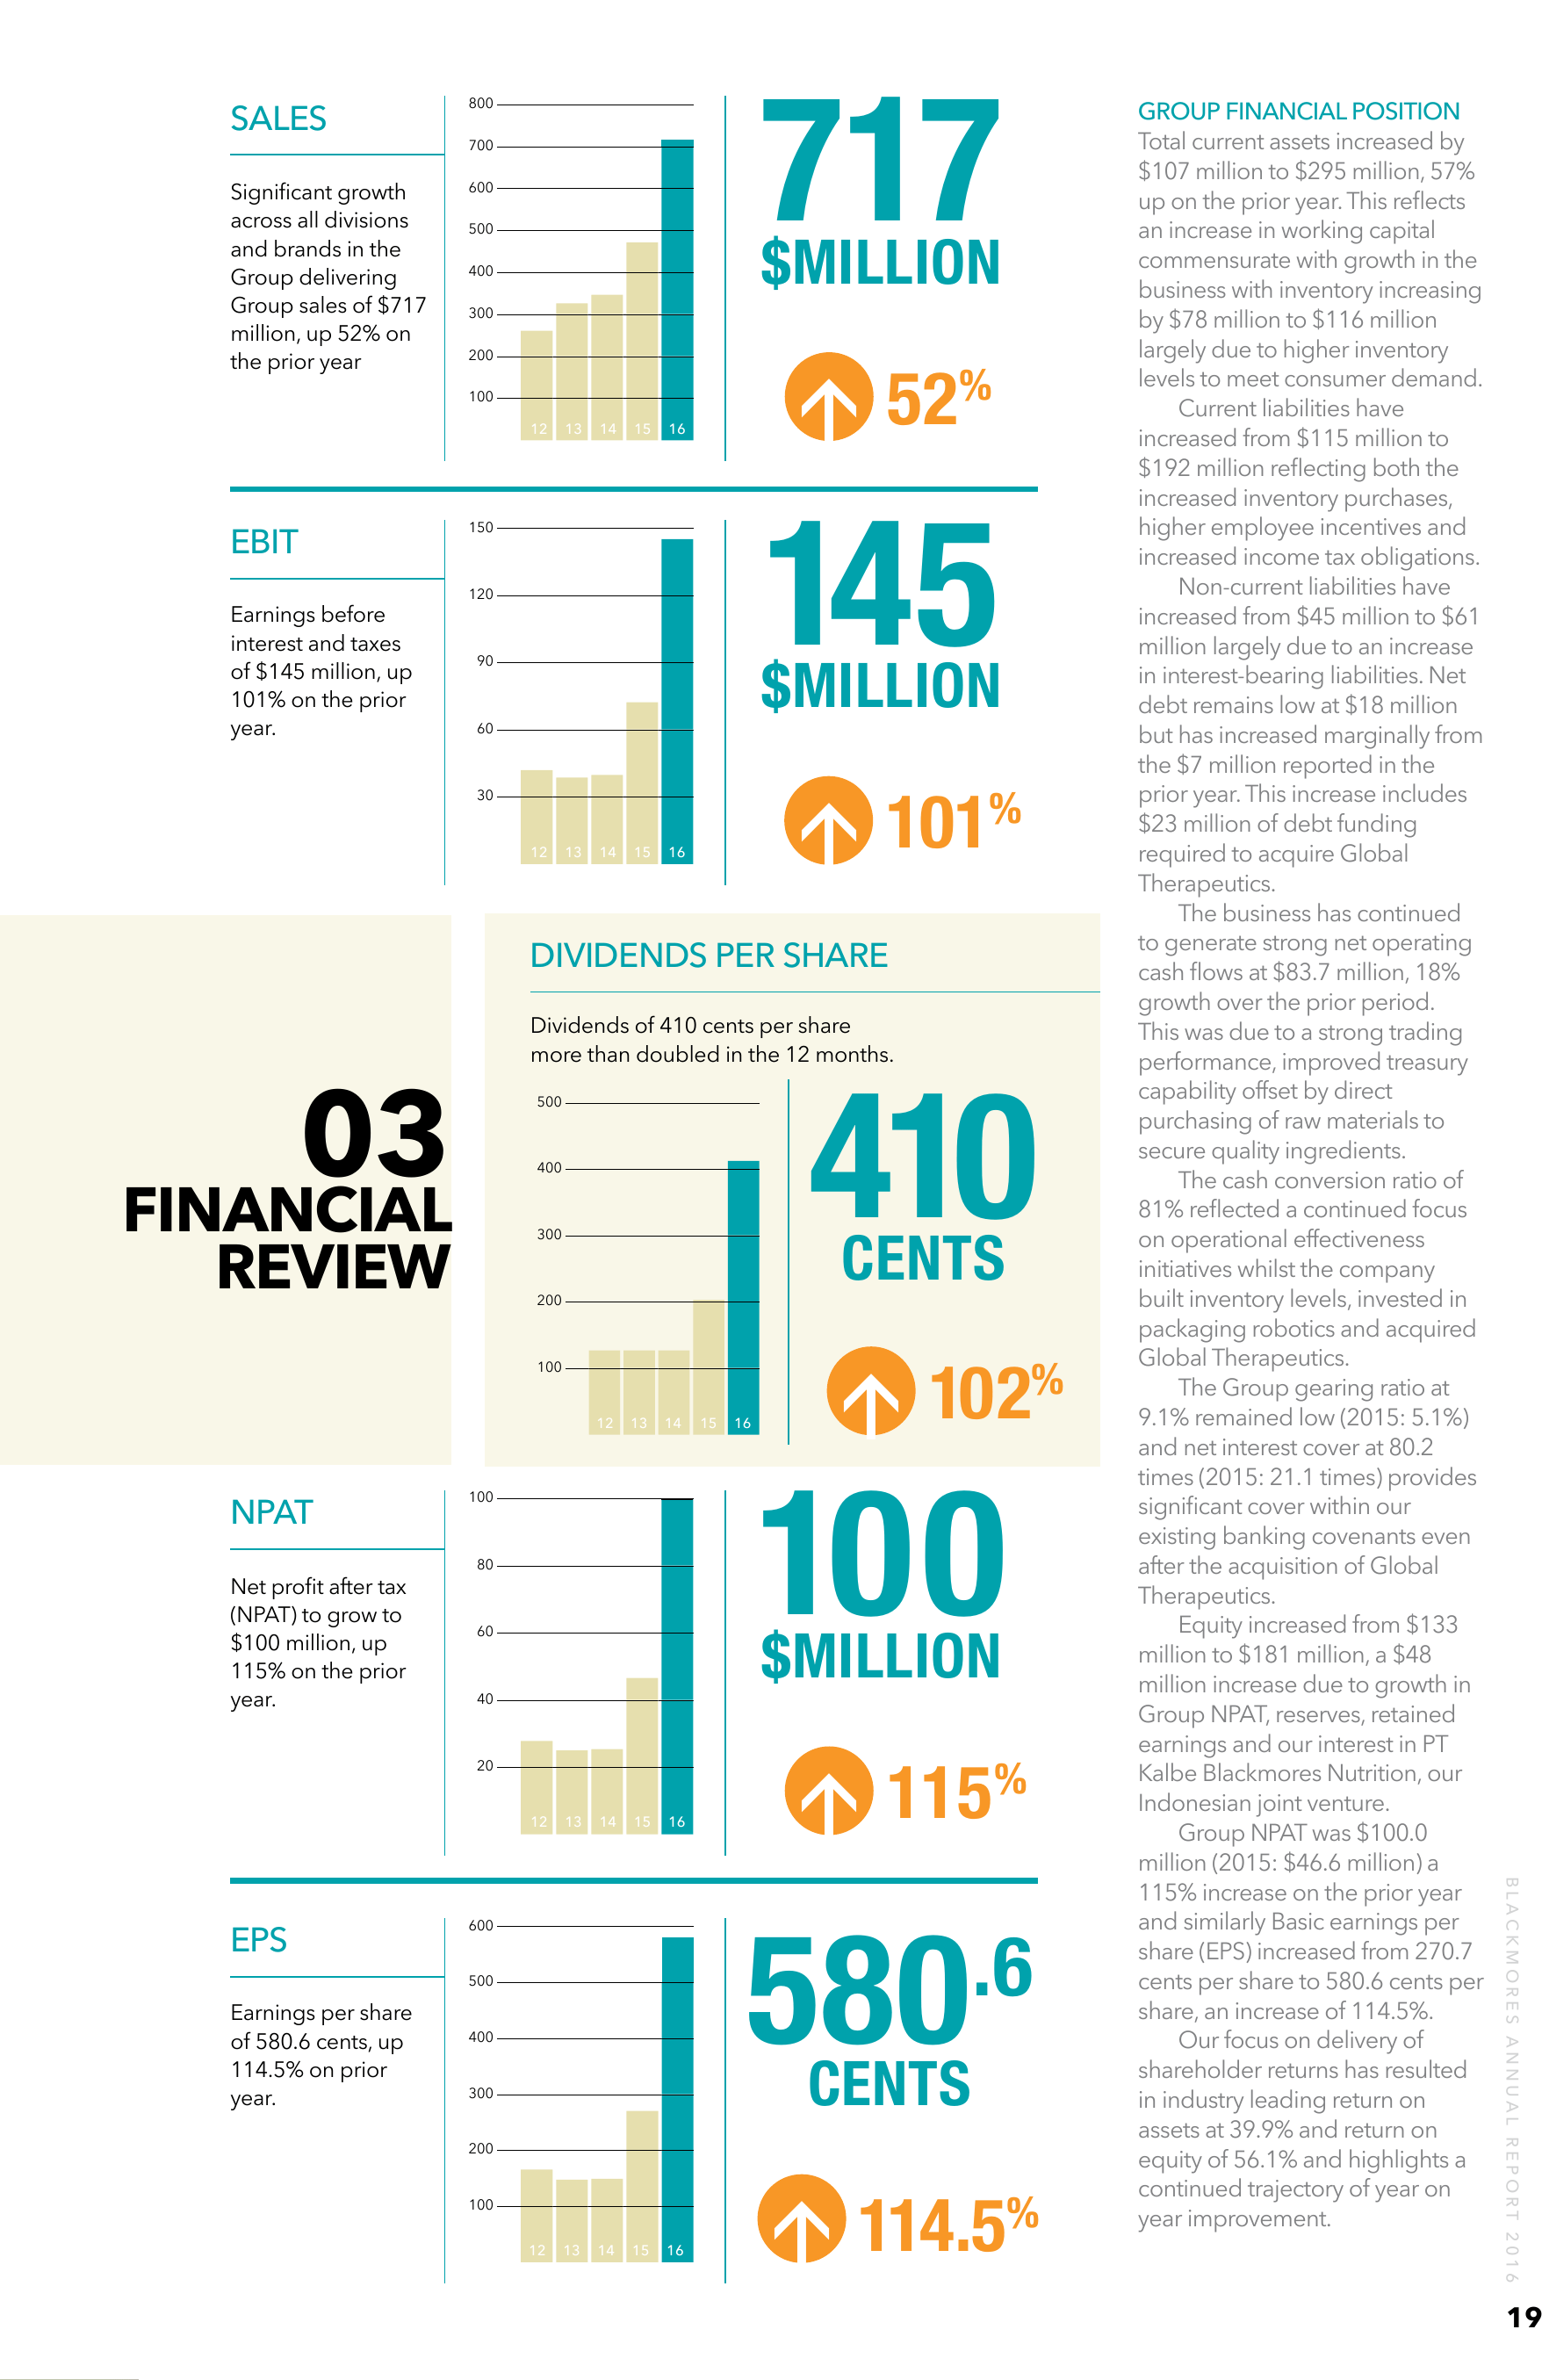
SALES
Significant growth
across all divisions
and brands in the
Group delivering
Group sales of $717
million, up 52% on
the prior year
717
800
600
700
500
$MILLION
400
300
>
200
100
12
EBIT
Earnings before
interest and taxes
of $145 million, up
101% on the prior
year.
13
14
15
16
52%
145
150
120
$MILLION
90
60
12
13
14
15
>
30
16
101%
DIVIDENDS PER SHARE
Dividends of 410 cents per share
more than doubled in the 12 months.
03
FINANCIAL
410
500
400
REVIEW
CENTS
300
100
12
80
102%
$MILLION
60
40
12
13
14
15
16
115%
400
300
.6
200
100
12
13
14
15
16
114.5%
BLACKMORES ANNUAL REPORT 2016
580
CENTS
600
500
Earnings per share
of 580.6 cents, up
114.5% on prior
year.
16
100
100
20
EPS
15
>
Net profit after tax
(NPAT) to grow to
$100 million, up
115% on the prior
year.
14
>
NPAT
13
>
200
GROUP FINANCIAL POSITION
Total current assets increased by
$107 million to $295 million, 57%
up on the prior year. This reflects
an increase in working capital
commensurate with growth in the
business with inventory increasing
by $78 million to $116 million
largely due to higher inventory
levels to meet consumer demand.
Current liabilities have
increased from $115 million to
$192 million reflecting both the
increased inventory purchases,
higher employee incentives and
increased income tax obligations.
Non-current liabilities have
increased from $45 million to $61
million largely due to an increase
in interest-bearing liabilities. Net
debt remains low at $18 million
but has increased marginally from
the $7 million reported in the
prior year. This increase includes
$23 million of debt funding
required to acquire Global
Therapeutics.
The business has continued
to generate strong net operating
cash flows at $83.7 million, 18%
growth over the prior period.
This was due to a strong trading
performance, improved treasury
capability offset by direct
purchasing of raw materials to
secure quality ingredients.
The cash conversion ratio of
81% reflected a continued focus
on operational effectiveness
initiatives whilst the company
built inventory levels, invested in
packaging robotics and acquired
Global Therapeutics.
The Group gearing ratio at
9.1% remained low (2015: 5.1%)
and net interest cover at 80.2
times (2015: 21.1 times) provides
significant cover within our
existing banking covenants even
after the acquisition of Global
Therapeutics.
Equity increased from $133
million to $181 million, a $48
million increase due to growth in
Group NPAT, reserves, retained
earnings and our interest in PT
Kalbe Blackmores Nutrition, our
Indonesian joint venture.
Group NPAT was $100.0
million (2015: $46.6 million) a
115% increase on the prior year
and similarly Basic earnings per
share (EPS) increased from 270.7
cents per share to 580.6 cents per
share, an increase of 114.5%.
Our focus on delivery of
shareholder returns has resulted
in industry leading return on
assets at 39.9% and return on
equity of 56.1% and highlights a
continued trajectory of year on
year improvement.
19