2016
REMUNERATION
REPORT
Introduction from the Chairman of the People and Remuneration Committee
Dear Shareholder,
I am pleased to present our Remuneration Report for 2016, which is designed to provide a clear summary of the remuneration strategy,
arrangements and outcomes for the Chief Executive Officer (CEO), direct reports to the CEO (Senior Executives) and Non-Executive Directors.
2016 was another exceptional year of sales and profit growth across all areas of the business. These outstanding results are directly attributable
to the dedication and quality of our people.
Throughout the year, management:
• Continued to deliver on the Group strategy to grow the business – sales up 52% and NPAT up 115%.
• Continued to deliver on the Group strategy to grow the Australian business – Australian revenue up 56.5% and EBIT up 100.9%.
• Continued to grow Blackmores’ business in Asia – total Asia sales up 54% and Asian consumers now influence 50% of Group revenue.
• Continued to invest in world class innovation and new product development – launched 117 new products, announced a partnership with
Bega to produce nutritional foods, and acquired Global Therapeutics, a leader in Chinese herbal medicine.
• Delivered responsible financial management resulting in strong net operating cash flows of $83.7 million, net debt of $17.8 million, and
return on shareholders’ equity of 56.1%.
These successes have been recognised in our share price which increased by 75% per cent during the year. We were one of the highest
performing stock of the S&P/ASX 100 companies during 2016.
Blackmores delivered total shareholders’ return (TSR) of 180% for FY16 and EPS accretion of 114.5% and dividend growth of 102%.
ALIGNING REMUNERATION WITH BUSINESS PERFORMANCE AND STRATEGY
Following last year’s record growth across all areas of the business we reviewed our remuneration framework to ensure that it retains our key
executives, rewards and recognises the individual contributions of our people and further inspires them to achieve results aligned to business
strategy and shareholder interests. As part of this review, and with particular note to the growing size and resulting market capitalisation of the
Company, the Committee conducted a thorough external benchmarking review of Senior Executive and Non-Executive Director Remuneration.
KEY OUTCOMES FOR FY16 REMUNERATION
1. Following the external benchmarking review, the Board undertook to increase the Fixed Annual Remuneration (FAR) of some senior
executives. The increases ranged between 3% and 22%. Full details are on page 53.
2. The Board is very pleased with the ongoing performance of the CEO in continuing to deliver against the business strategy and leading the
organisation through a period of unprecedented change and extraordinary growth. With regard to performance, relevant benchmarks and
previous modest increases in FAR, the Board increased the CEO’s FAR by 29%. It is the intention of the Board to conduct another review of
the CEO’s FAR for FY17.
3. In a year in which Blackmores delivered TSR of 180% and NPAT growth of 115%, it was appropriate to see NPAT financial targets for the Group
and for most of Blackmores businesses achieved or exceeded. This triggered the payment of $3,563,981 of short-term incentives (STI) to Key
Management Personnel (KMP) for FY16 which was higher than FY15 STI payments. Additionally, for the first time the FY16 STI maximum potential
incentive was set at 100% FAR and it is very pleasing to see that many senior executives have achieved this outcome. The CEO received $890,098
in STI for FY16 which represented 100% FAR. The STI was based on statutory NPAT and the Board did not exercise discretion in changing the
calculation for purposes of determining the financial achievement of targets. Full details of the STI payments are on page 55.
4. The Board was also very pleased that under the long-standing Profit Share scheme, whereby of 10% of NPAT is paid to employees of
Blackmores, delivered 44 days incremental salary for each employee as a result of the record profit.
5. No executive long-term incentive (LTI) awards were eligible to vest in FY16 as the first three year LTI plan came into effect at the beginning of
FY15. The FY16 LTI plan remains a three year plan. The total remuneration for the financial year, the details of which are shown on page 53,
includes an accounting expense for all unvested performance rights and has been calculated using the value of the maximum number of
rights that could vest over the three year performance period of each LTI plan.
BLACKMORES ANNUAL REPORT 2016
44
6. In line with market capitalisation growth and following a review of relevant external benchmarks, Non-Executive Director fees were increased
by 13.5%. Shareholders approved an increase of $300,000 to the total Directors Fee pool at the FY15 AGM. The total pool is now $1,000,000.
FUTURE CHANGES TO REMUNERATION BEING CONSIDERED
The FY17 LTI achievement hurdles have been increased following a review of market benchmarks and further consultation. The LTI plan will have
an increased threshold hurdle of 5% three year compound annual growth rate (CAGR) in EPS. In order to receive the maximum award under the
plan an achievement of 25% CAGR will be required. These new hurdles will ensure that executive reward is aligned with increasing shareholder
value, a continuous focus on the successful achievement of long-term strategic goals and long-term retention of key executive management.
On behalf of the Board and People and Remuneration Committee, I invite you to read the 2016 Remuneration Report and welcome your
feedback on our approach to and disclosure of Blackmores’ remuneration arrangements.
Helen Nash
Chairman, People and Remuneration Committee
CONTENTS
2016
REMUNERATION
REPORT
1. Introduction
2. Senior Executive Remuneration Table – Non-statutory
3. Remuneration Governance and Framework
4. Senior Executive Remuneration Structure
5. Performance and Remuneration Outcomes
6. Senior Executive Remuneration Tables – Statutory
7. Employment Contracts
8. Non-Executive Directors’ Remuneration
9. Non-Executive Directors and Senior Executive Transactions
1. INTRODUCTION
The Directors of Blackmores Limited present the Remuneration Report (the ‘Report‘) for the Blackmores Group. The Report outlines
Blackmores’ remuneration framework and the outcomes for the year ended 30 June 2016 (FY16) for Blackmores Key Management Personnel.
The Report has been prepared in accordance with the requirements of section 300A of the Corporations Act 2001.
In this Report the following terms and phrases have the meanings indicated below:
Executive Directors – Chairman and the Chief Executive Officer and Managing Director.
Directors – Executive Directors and Non-Executive Directors.
Key Management Personnel – Non-Executive Directors and Senior Executives
Senior Executives – Executive Directors and the other company executives who have authority and responsibility for planning, directing and
controlling the activities of the Blackmores Group, directly or indirectly.
Exercised – Owned.
Granted – Assigned to, but not yet vested.
Vested – Met performance criteria and available to be exercised, but not yet owned.
Key Management Personnel
The following table lists all the current Key Management Personnel (KMP) referred to in this Report:
Non-Executive Directors
David Ansell
Non-Executive Director and member of the Audit and Risk Committee and Nominations Committee
John Armstrong
Non-Executive Director and member of the Audit and Risk Committee and Nominations Committee
Stephen Chapman
Non-Executive Director, Deputy Chairman, Chairman of the Nominations Committee, member of the Audit and Risk
Committee and People and Remuneration Committee
Helen Nash
Non-Executive Director, Chairman of the People and Remuneration Committee and member of the Nominations
Committee
Brent Wallace
Non-Executive Director, Chairman of the Audit and Risk Committee, member of the People and Remuneration
Committee and Nominations Committee
Executive Directors
Marcus Blackmore
Chairman of the Board, member of the People and Remuneration Committee and Nominations Committee
Christine Holgate
Chief Executive Officer, Managing Director and member of the Nominations Committee
Senior Executives
Lesley Braun
Director Blackmores Institute
Aaron Canning
Chief Financial Officer
Nathan Cheong
Managing Director BioCeuticals
Cecile Cooper
Company Secretary and Director of Corporate Affairs
David Fenlon
Managing Director Australia and New Zealand
Richard Henfrey
Chief Operating Officer
Peter Osborne
Managing Director Asia
BLACKMORES ANNUAL REPORT 2016
45
2016
REMUNERATION
REPORT
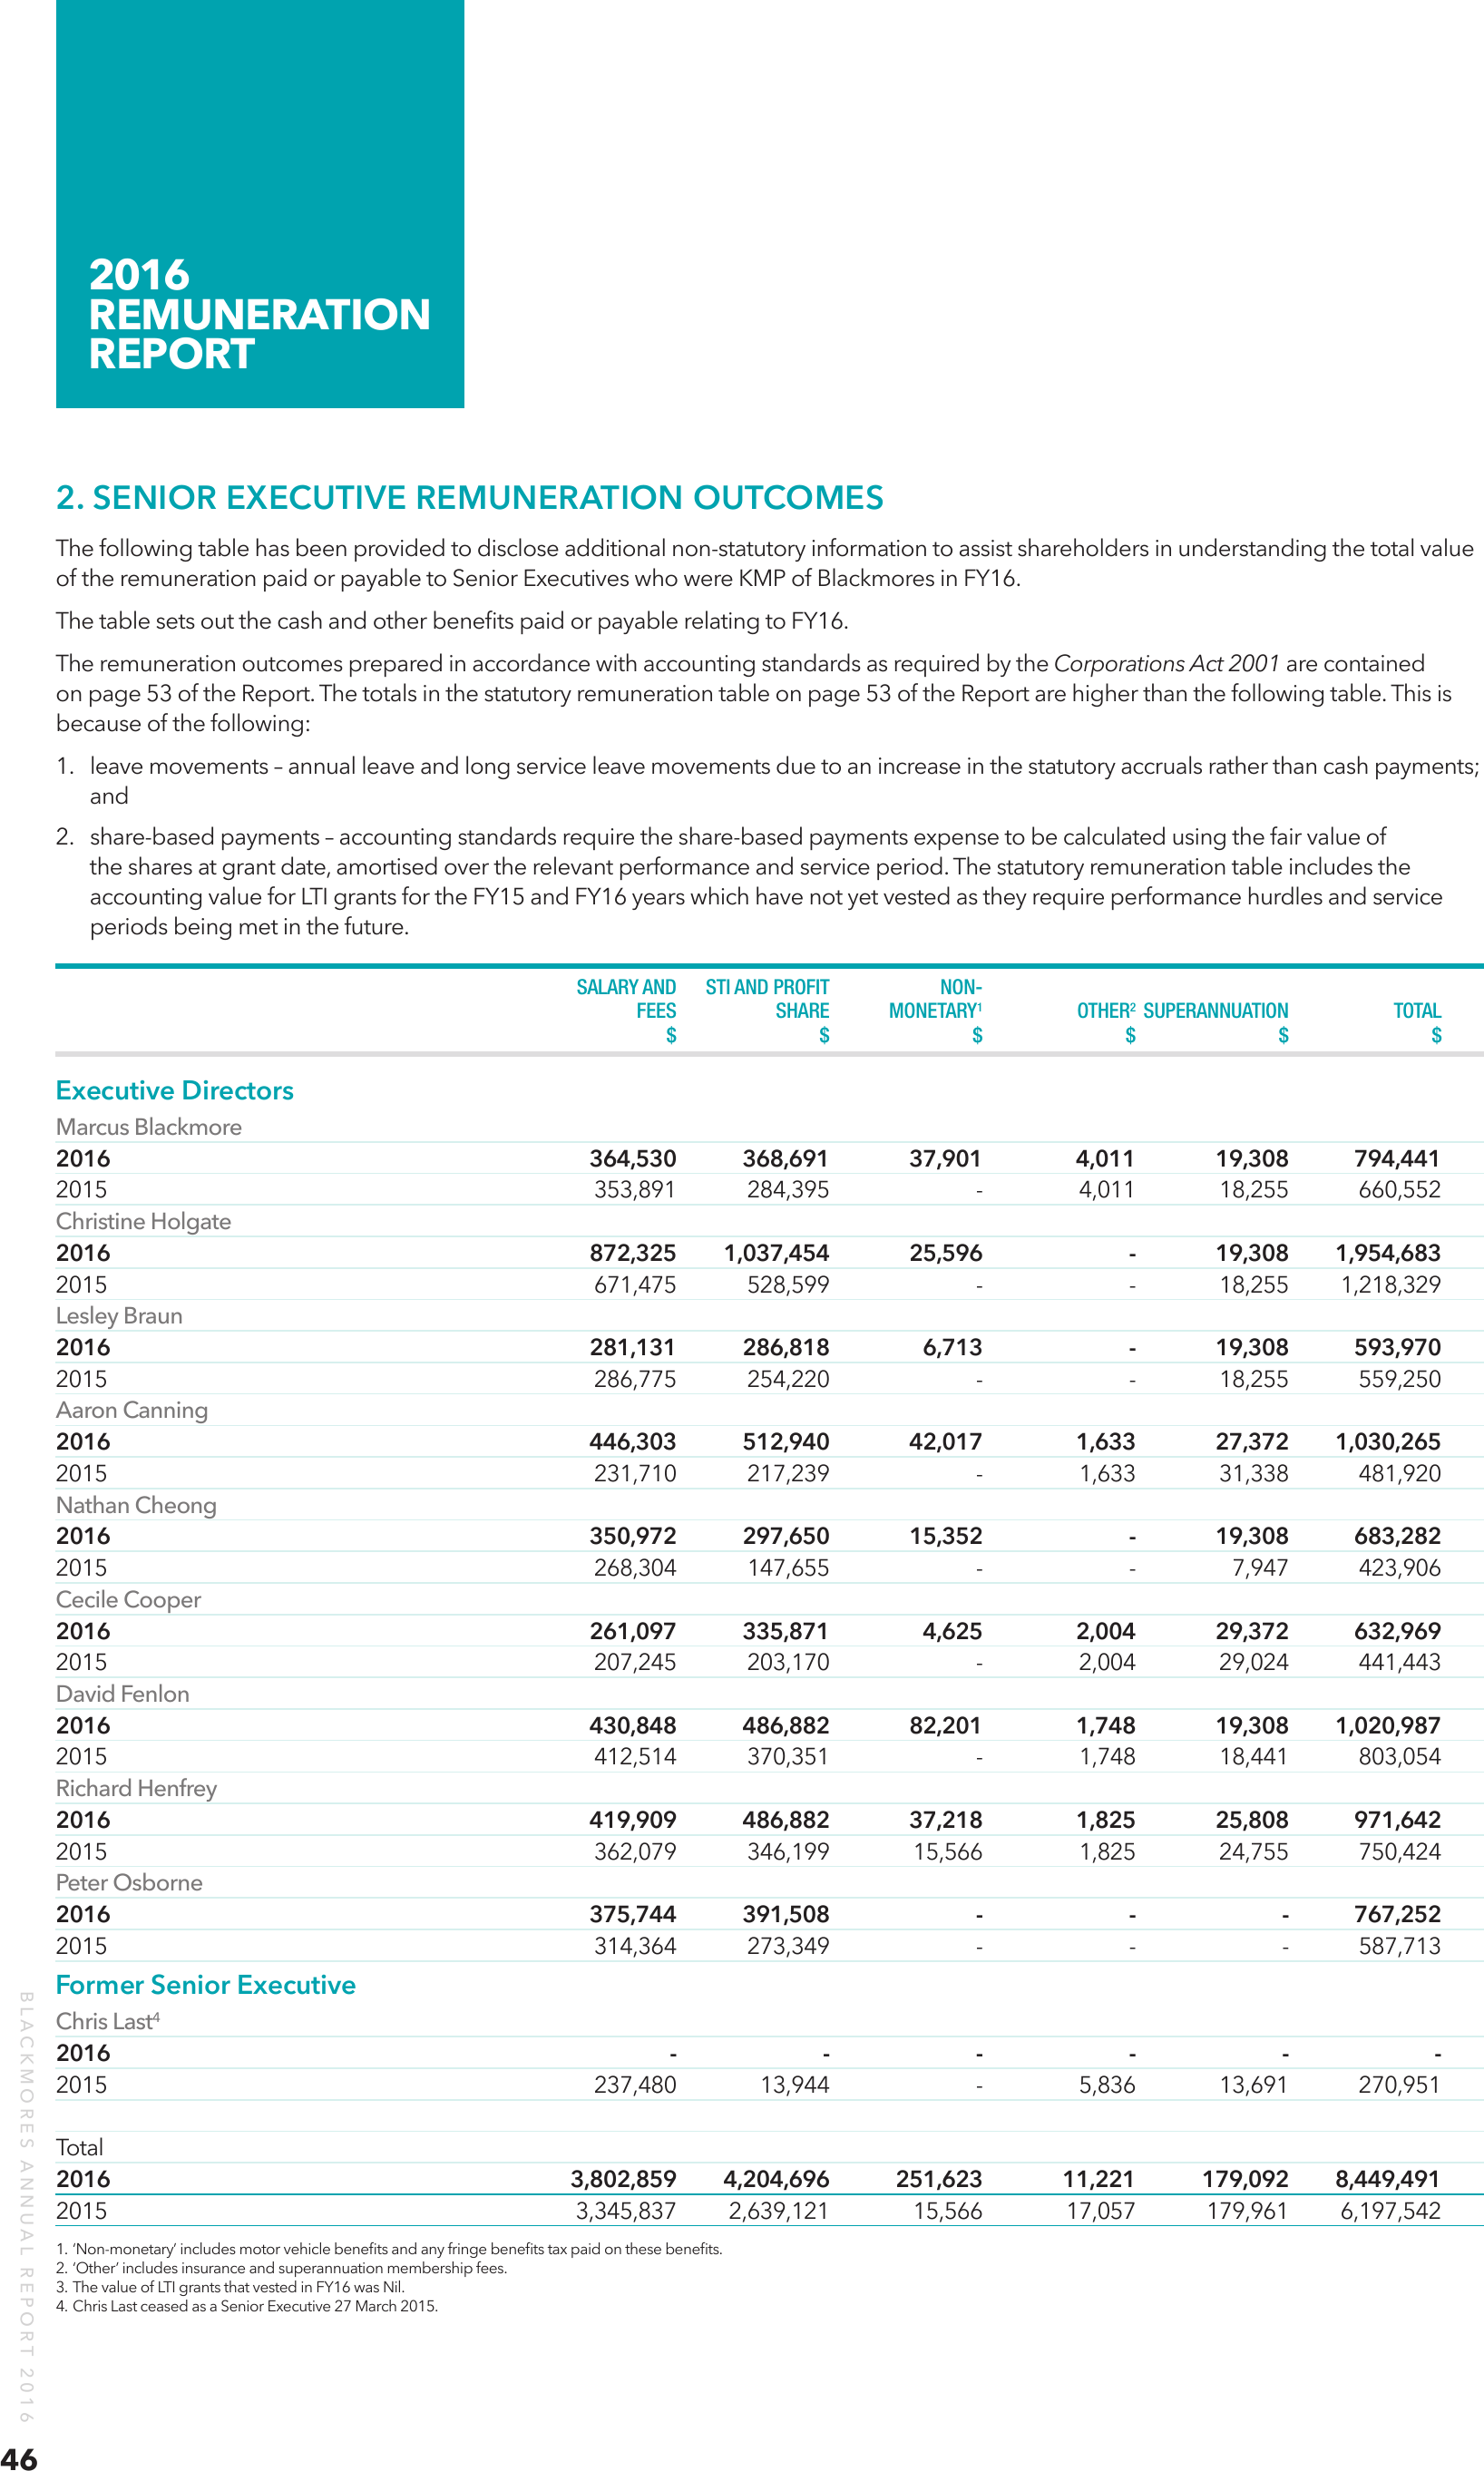
2. SENIOR EXECUTIVE REMUNERATION OUTCOMES
The following table has been provided to disclose additional non-statutory information to assist shareholders in understanding the total value
of the remuneration paid or payable to Senior Executives who were KMP of Blackmores in FY16.
The table sets out the cash and other benefits paid or payable relating to FY16.
The remuneration outcomes prepared in accordance with accounting standards as required by the Corporations Act 2001 are contained
on page 53 of the Report. The totals in the statutory remuneration table on page 53 of the Report are higher than the following table. This is
because of the following:
1. leave movements – annual leave and long service leave movements due to an increase in the statutory accruals rather than cash payments;
and
2. share-based payments – accounting standards require the share-based payments expense to be calculated using the fair value of
the shares at grant date, amortised over the relevant performance and service period. The statutory remuneration table includes the
accounting value for LTI grants for the FY15 and FY16 years which have not yet vested as they require performance hurdles and service
periods being met in the future.
SALARY AND STI AND PROFIT
NON-
FEES
SHARE MONETARY1
OTHER2 SUPERANNUATION
TOTAL
$ $ $ $ $ $
Executive Directors
Marcus Blackmore
2016
364,530
368,691
37,901
4,011
19,308
794,441
2015
353,891
284,395
-
4,011
18,255
660,552
Christine Holgate
2016
872,325
1,037,454
25,596
-
19,308
1,954,683
2015
671,475
528,599
-
-
18,255
1,218,329
Lesley Braun
2016
281,131
286,818
6,713
-
19,308
593,970
2015
286,775
254,220
-
-
18,255
559,250
Aaron Canning
2016
446,303
512,940
42,017
1,633
27,372
1,030,265
2015
231,710
217,239
-
1,633
31,338
481,920
Nathan Cheong
2016
350,972
297,650
15,352
-
19,308
683,282
2015
268,304
147,655
-
-
7,947
423,906
Cecile Cooper
2016
261,097
335,871
4,625
2,004
29,372
632,969
2015
207,245
203,170
-
2,004
29,024
441,443
David Fenlon
2016
430,848
486,882
82,201
1,748
19,308
1,020,987
2015
412,514
370,351
-
1,748
18,441
803,054
Richard Henfrey
2016
419,909
486,882
37,218
1,825
25,808
971,642
2015
362,079
346,199
15,566
1,825
24,755
750,424
Peter Osborne
2016
375,744
391,508
- - -
767,252
2015
314,364
273,349
- - -
587,713
BLACKMORES ANNUAL REPORT 2016
46
Former Senior Executive
Chris Last4
2016
- - - - - 2015
237,480
13,944
-
5,836
13,691
270,951
Total
2016
3,802,859
4,204,696 251,623 11,221 179,092
8,449,491
2015
3,345,837
2,639,121 15,566 17,057
179,961
6,197,542
1. ‘Non-monetary’ includes motor vehicle benefits and any fringe benefits tax paid on these benefits.
2. ‘Other’ includes insurance and superannuation membership fees.
3. The value of LTI grants that vested in FY16 was Nil.
4. Chris Last ceased as a Senior Executive 27 March 2015.
2016
REMUNERATION
REPORT
3. REMUNERATION GOVERNANCE AND FRAMEWORK
Remuneration Governance
People and Remuneration Committee
The primary responsibility of the People and Remuneration Committee (the ‘Committee‘) is to make recommendations to the Board on
remuneration strategy and policy for KMP and other executives of Blackmores that are in the best interests of Blackmores and its shareholders.
This includes recommendations related to Non-Executive Directors Fees, executive remuneration and Short-term Incentives (STI ) and
Long-term Incentive (LTI) schemes. The Committee also advises the Board on remuneration policies and practices for the Company. The
responsibilities of the People and Remuneration Committee are set out in the Committee’s charter which can be viewed or downloaded from
the Company’s website at blackmores.com.au (go to ‘Investor Centre’, then click on ‘Corporate Governance’). The charter is reviewed annually
by the Committee and the Board.
The People and Remuneration Committee comprises three independent Non-Executive Directors and the Executive Chairman who have
experience in both remuneration governance and the Blackmores business. The members during FY16 were Helen Nash (Committee
Chairman), Marcus Blackmore (Executive Chairman), Stephen Chapman and Brent Wallace.
Marcus Blackmore will cease be a member of the Committee in FY17 in accordance with ASX Listing Rule requirements.
Advisors to the Committee
The People and Remuneration Committee has established protocols for engaging and dealing with external advisors and this is included
in the Committee’s charter. The Committee obtains specialist external advice about remuneration structure and levels. The advice is used to
support its assessment of the market to ensure that Senior Executives and Non-Executive Directors are being rewarded appropriately, given
their responsibilities and experience. Executive remuneration packages are also reviewed annually against suitable benchmarks to ensure that
an appropriate balance between fixed and incentive pay is achieved.
The Committee did not use a remuneration consultant in the current financial year. Benchmarking of KMPs was conducted by utilising various
independent published remuneration surveys.
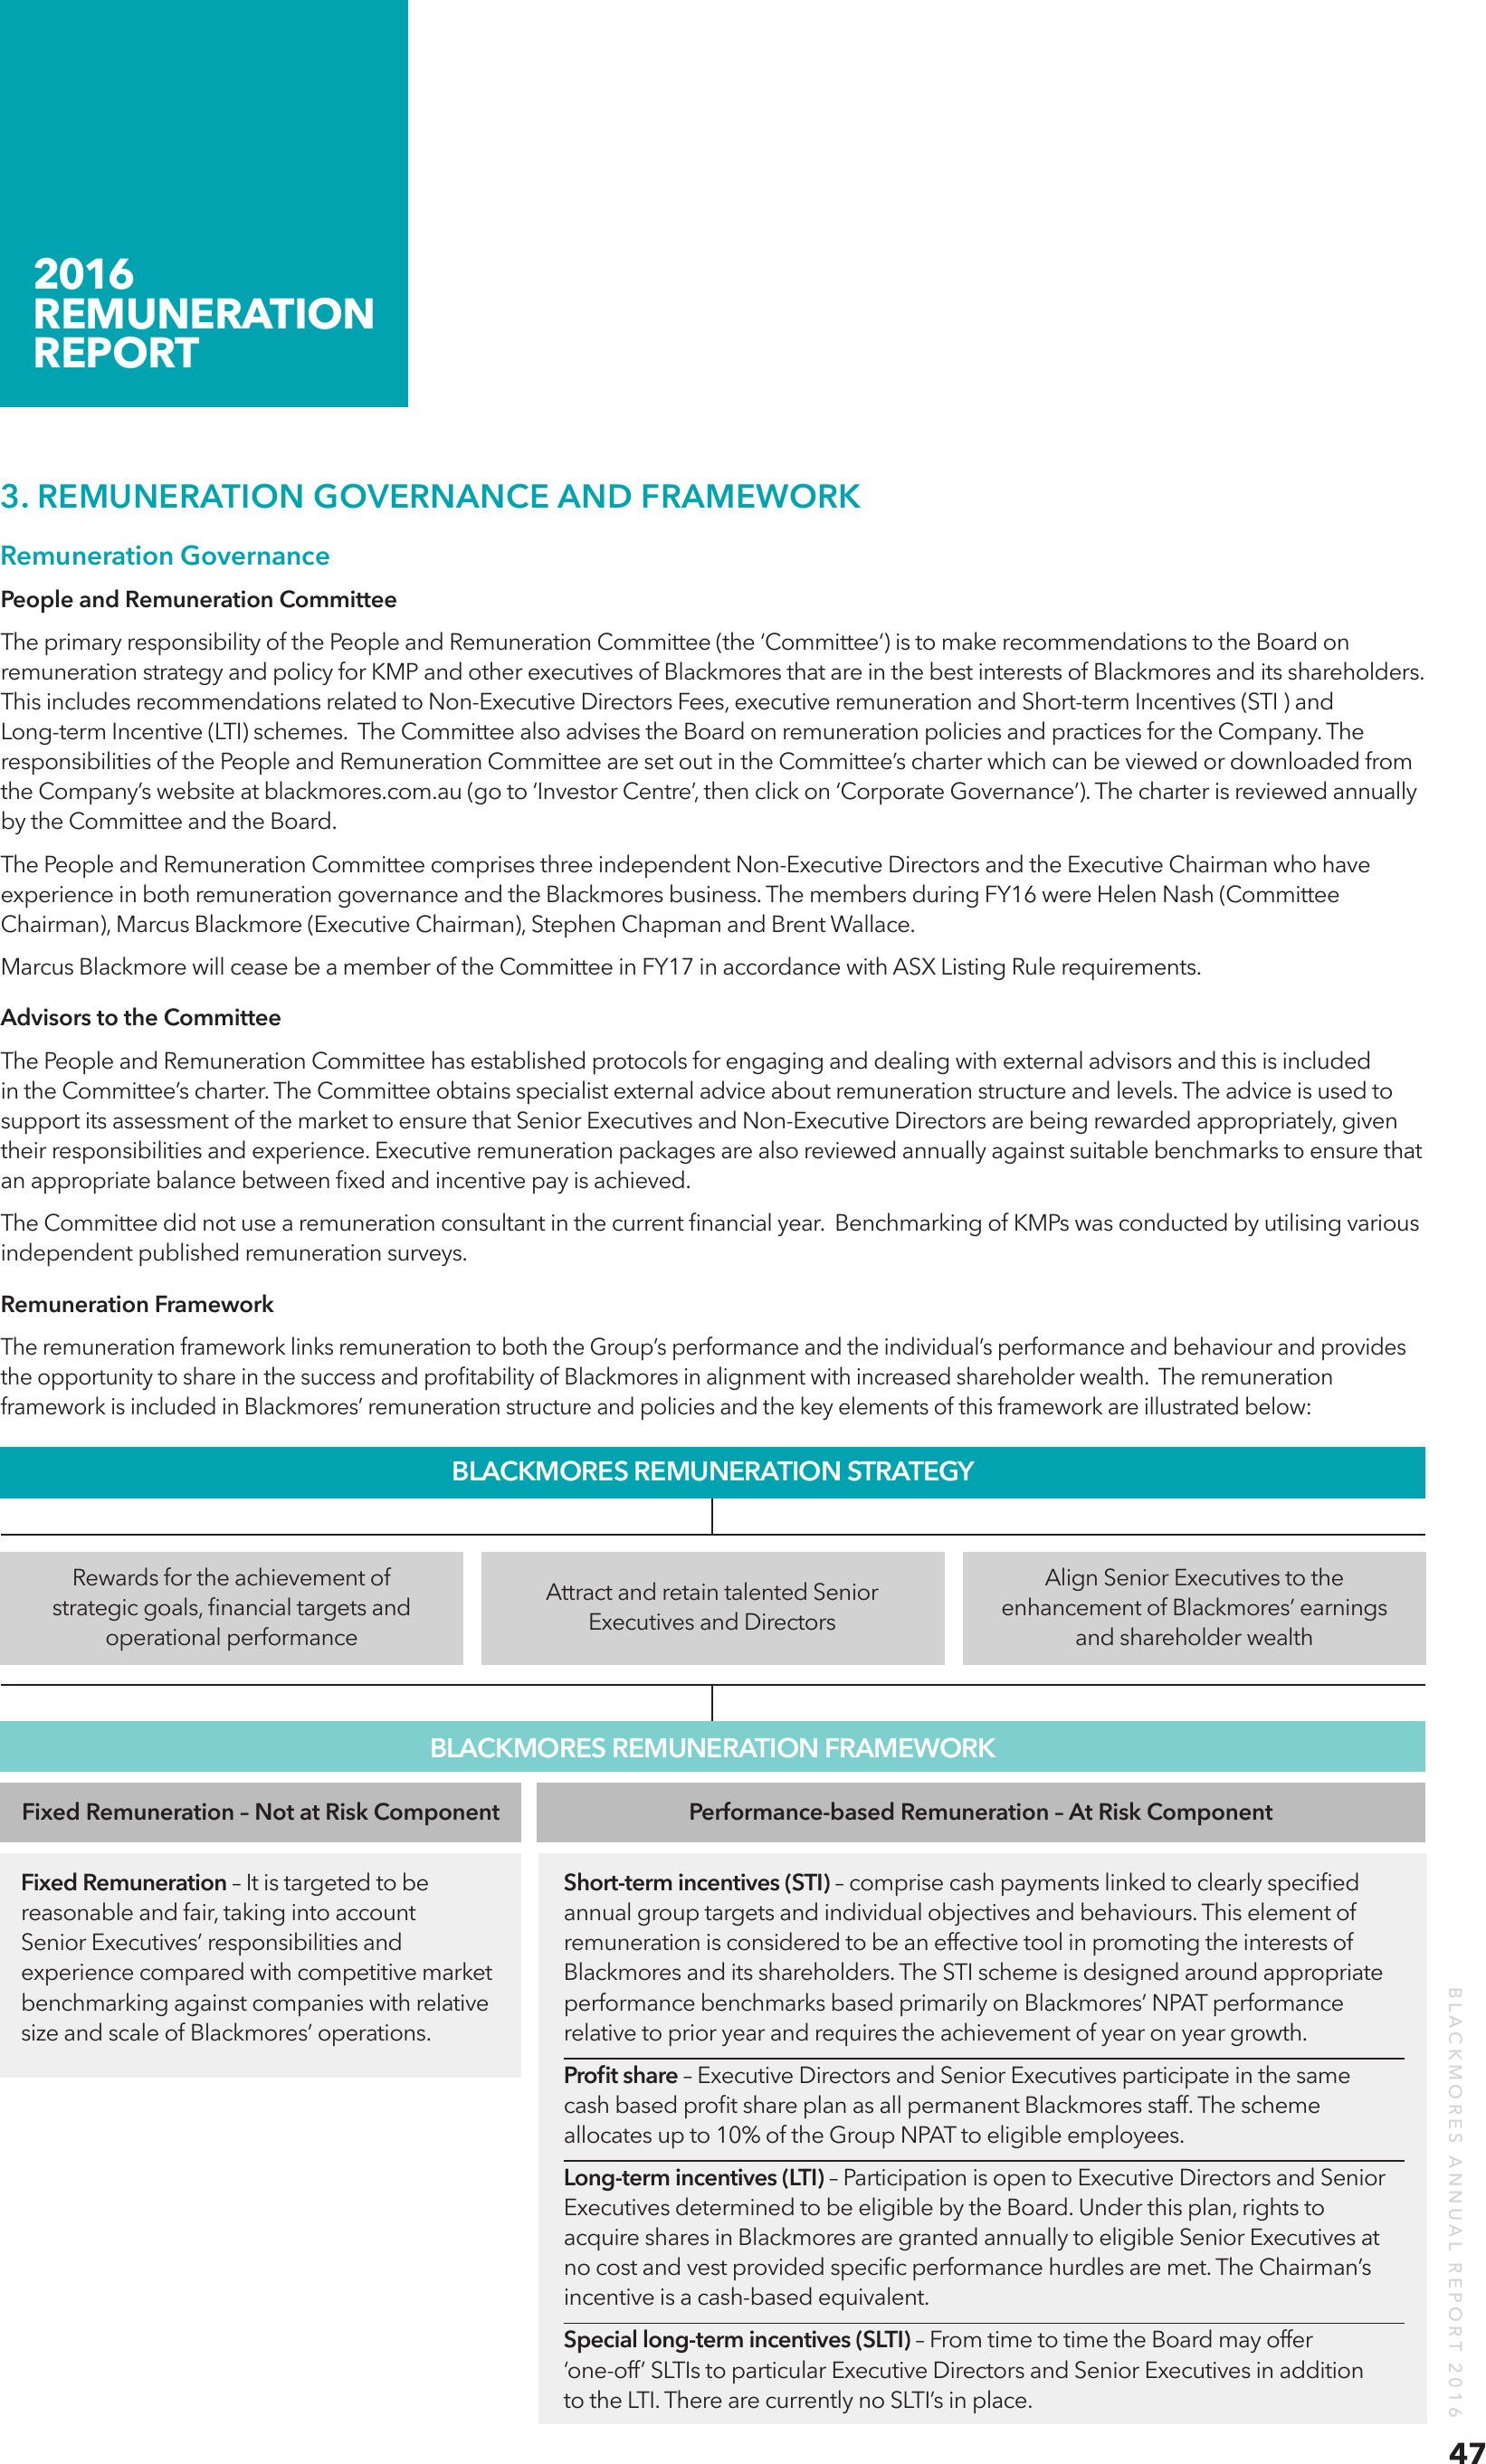
Remuneration Framework
The remuneration framework links remuneration to both the Group’s performance and the individual’s performance and behaviour and provides
the opportunity to share in the success and profitability of Blackmores in alignment with increased shareholder wealth. The remuneration
framework is included in Blackmores’ remuneration structure and policies and the key elements of this framework are illustrated below:
BLACKMORES REMUNERATION STRATEGY
Rewards for the achievement of
strategic goals, financial targets and
operational performance
Attract and retain talented Senior
Executives and Directors
Align Senior Executives to the
enhancement of Blackmores’ earnings
and shareholder wealth
BLACKMORES REMUNERATION FRAMEWORK
Fixed Remuneration – Not at Risk Component
Short-term incentives (STI) – comprise cash payments linked to clearly specified
annual group targets and individual objectives and behaviours. This element of
remuneration is considered to be an effective tool in promoting the interests of
Blackmores and its shareholders. The STI scheme is designed around appropriate
performance benchmarks based primarily on Blackmores’ NPAT performance
relative to prior year and requires the achievement of year on year growth.
Profit share – Executive Directors and Senior Executives participate in the same
cash based profit share plan as all permanent Blackmores staff. The scheme
allocates up to 10% of the Group NPAT to eligible employees.
Long-term incentives (LTI) – Participation is open to Executive Directors and Senior
Executives determined to be eligible by the Board. Under this plan, rights to
acquire shares in Blackmores are granted annually to eligible Senior Executives at
no cost and vest provided specific performance hurdles are met. The Chairman’s
incentive is a cash-based equivalent.
Special long-term incentives (SLTI) – From time to time the Board may offer
‘one-off’ SLTIs to particular Executive Directors and Senior Executives in addition
to the LTI. There are currently no SLTI’s in place.
BLACKMORES ANNUAL REPORT 2016
Fixed Remuneration – It is targeted to be
reasonable and fair, taking into account
Senior Executives’ responsibilities and
experience compared with competitive market
benchmarking against companies with relative
size and scale of Blackmores’ operations.
Performance-based Remuneration – At Risk Component
47
2016
REMUNERATION
REPORT
4. SENIOR EXECUTIVE REMUNERATION STRUCTURE
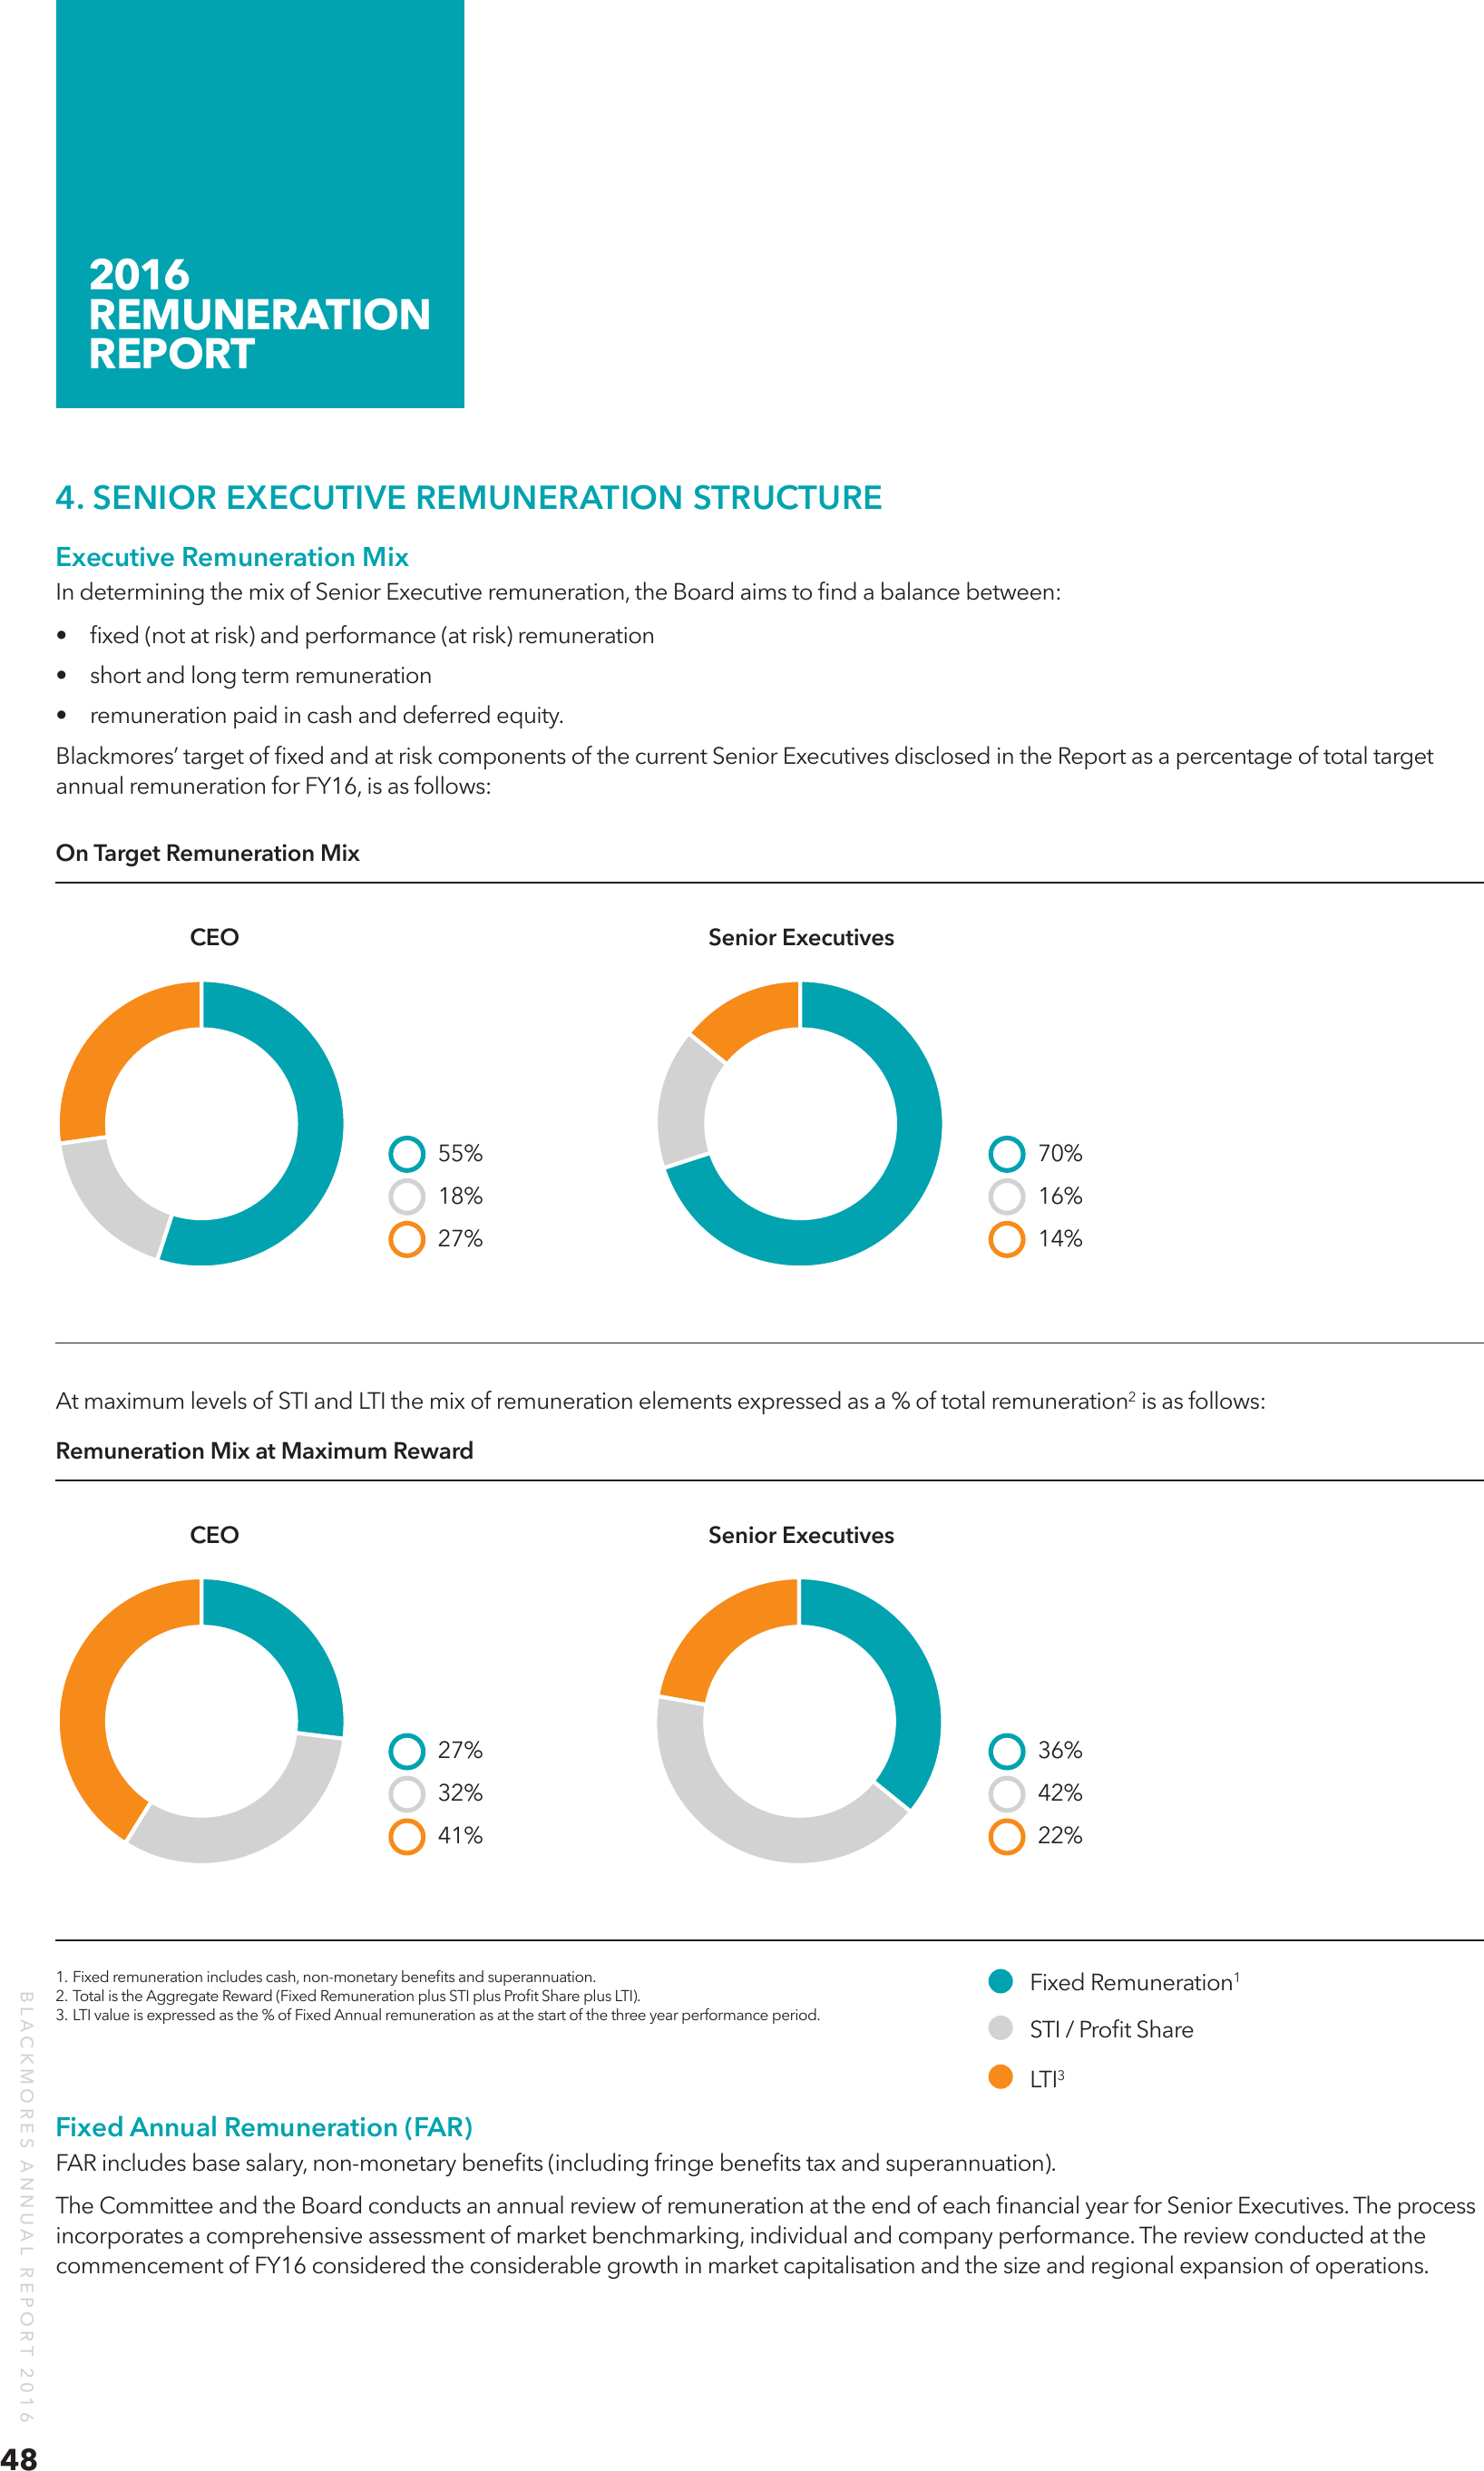
Executive Remuneration Mix
In determining the mix of Senior Executive remuneration, the Board aims to find a balance between:
• fixed (not at risk) and performance (at risk) remuneration
• short and long term remuneration
• remuneration paid in cash and deferred equity.
Blackmores’ target of fixed and at risk components of the current Senior Executives disclosed in the Report as a percentage of total target
annual remuneration for FY16, is as follows:
On Target Remuneration Mix
CEO
Senior Executives
55%
70%
18%
16%
27%
14%
At maximum levels of STI and LTI the mix of remuneration elements expressed as a % of total remuneration2 is as follows:
Remuneration Mix at Maximum Reward
CEO
Senior Executives
27%
32%
42%
41%
BLACKMORES ANNUAL REPORT 2016
48
36%
22%
1. Fixed remuneration includes cash, non-monetary benefits and superannuation.
2. Total is the Aggregate Reward (Fixed Remuneration plus STI plus Profit Share plus LTI).
3. LTI value is expressed as the % of Fixed Annual remuneration as at the start of the three year performance period.
Fixed Remuneration1
STI / Profit Share
LTI3
Fixed Annual Remuneration (FAR)
FAR includes base salary, non-monetary benefits (including fringe benefits tax and superannuation).
The Committee and the Board conducts an annual review of remuneration at the end of each financial year for Senior Executives. The process
incorporates a comprehensive assessment of market benchmarking, individual and company performance. The review conducted at the
commencement of FY16 considered the considerable growth in market capitalisation and the size and regional expansion of operations.
2016
REMUNERATION
REPORT
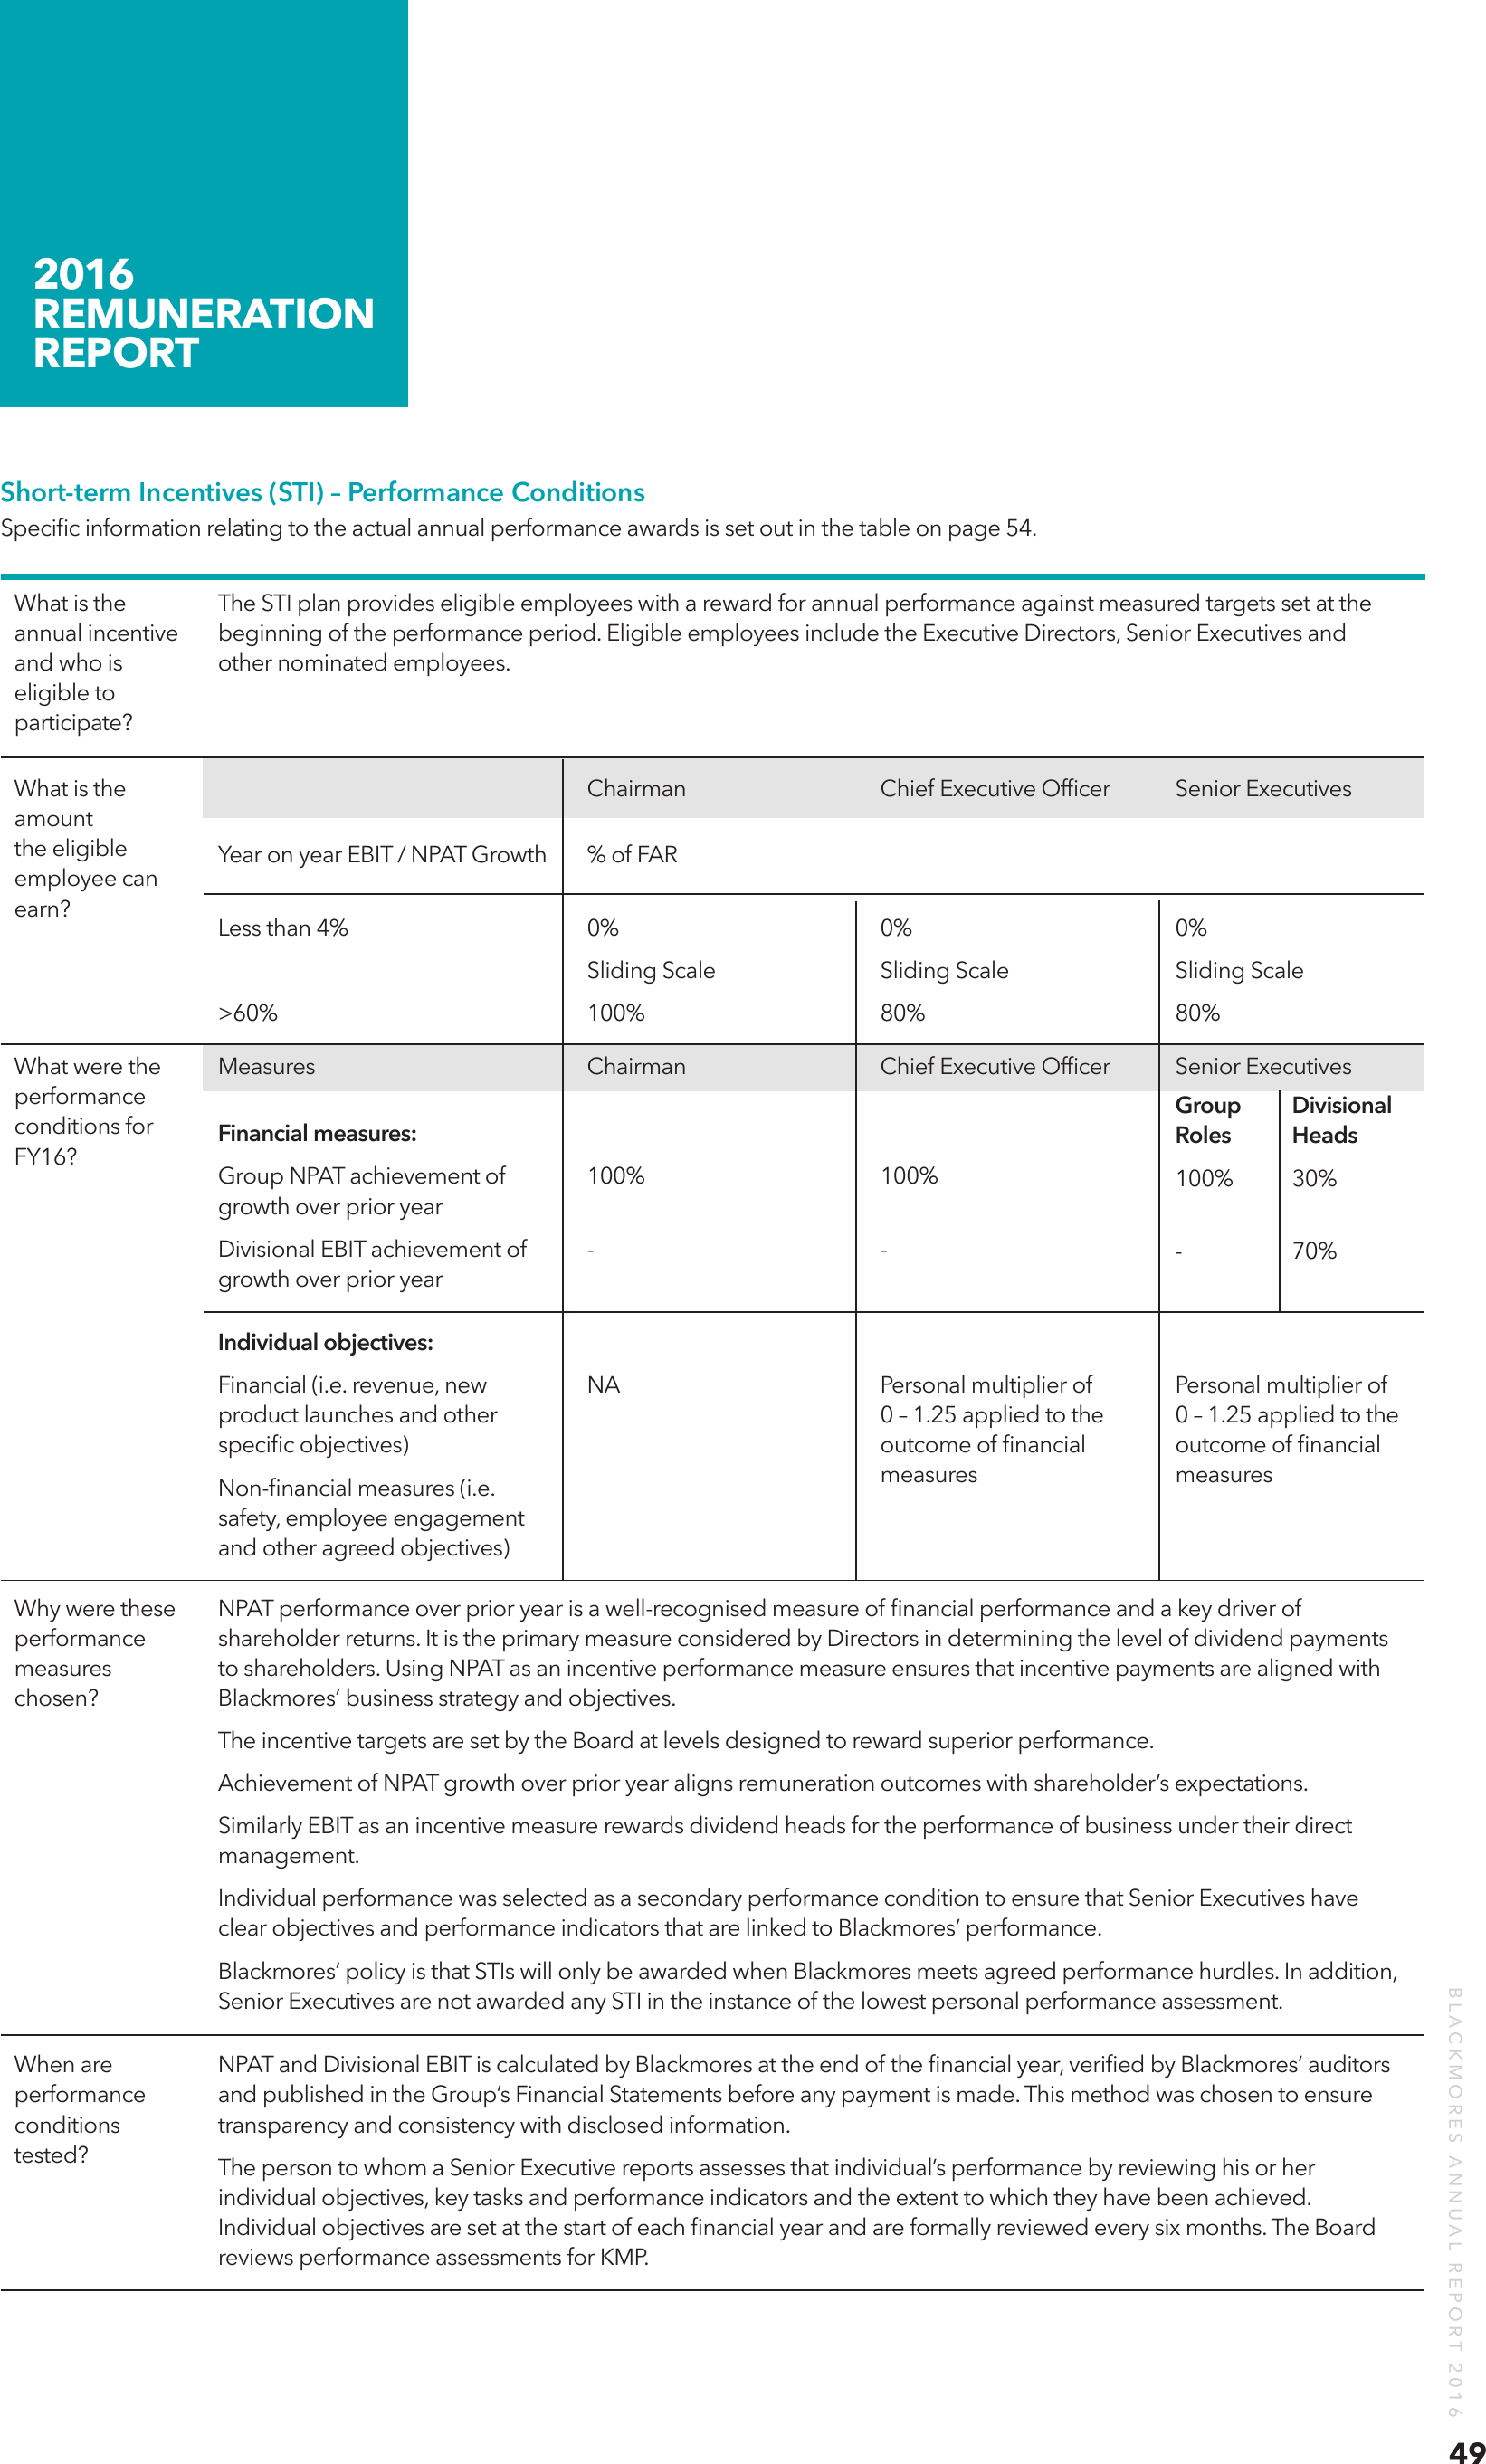
Short-term Incentives (STI) – Performance Conditions
Specific information relating to the actual annual performance awards is set out in the table on page 54.
What is the
annual incentive
and who is
eligible to
participate?
What is the
amount
the eligible
employee can
earn?
The STI plan provides eligible employees with a reward for annual performance against measured targets set at the
beginning of the performance period. Eligible employees include the Executive Directors, Senior Executives and
other nominated employees.
Chairman
Chief Executive Officer
Senior Executives
% of FAR
Less than 4%
0%
0%
0%
Sliding Scale
Sliding Scale
Sliding Scale
>60%
What were the
performance
conditions for
FY16?
Year on year EBIT / NPAT Growth
100%
80%
80%
Measures
Chairman
Chief Executive Officer
Senior Executives
Group
Divisional
Roles Heads
Financial measures:
Group NPAT achievement of
growth over prior year
100%
100%
100% 30%
Divisional EBIT achievement of
growth over prior year
-
-
- 70%
NA
Personal multiplier of
0 – 1.25 applied to the
outcome of financial
measures
Personal multiplier of
0 – 1.25 applied to the
outcome of financial
measures
Individual objectives:
Financial (i.e. revenue, new
product launches and other
specific objectives)
Non-financial measures (i.e.
safety, employee engagement
and other agreed objectives)
Why were these
performance
measures
chosen?
NPAT performance over prior year is a well-recognised measure of financial performance and a key driver of
shareholder returns. It is the primary measure considered by Directors in determining the level of dividend payments
to shareholders. Using NPAT as an incentive performance measure ensures that incentive payments are aligned with
Blackmores’ business strategy and objectives.
The incentive targets are set by the Board at levels designed to reward superior performance.
Achievement of NPAT growth over prior year aligns remuneration outcomes with shareholder’s expectations.
Similarly EBIT as an incentive measure rewards dividend heads for the performance of business under their direct
management.
Individual performance was selected as a secondary performance condition to ensure that Senior Executives have
clear objectives and performance indicators that are linked to Blackmores’ performance.
When are
performance
conditions
tested?
NPAT and Divisional EBIT is calculated by Blackmores at the end of the financial year, verified by Blackmores’ auditors
and published in the Group’s Financial Statements before any payment is made. This method was chosen to ensure
transparency and consistency with disclosed information.
The person to whom a Senior Executive reports assesses that individual’s performance by reviewing his or her
individual objectives, key tasks and performance indicators and the extent to which they have been achieved.
Individual objectives are set at the start of each financial year and are formally reviewed every six months. The Board
reviews performance assessments for KMP.
BLACKMORES ANNUAL REPORT 2016
Blackmores’ policy is that STIs will only be awarded when Blackmores meets agreed performance hurdles. In addition,
Senior Executives are not awarded any STI in the instance of the lowest personal performance assessment.
49
2016
REMUNERATION
REPORT
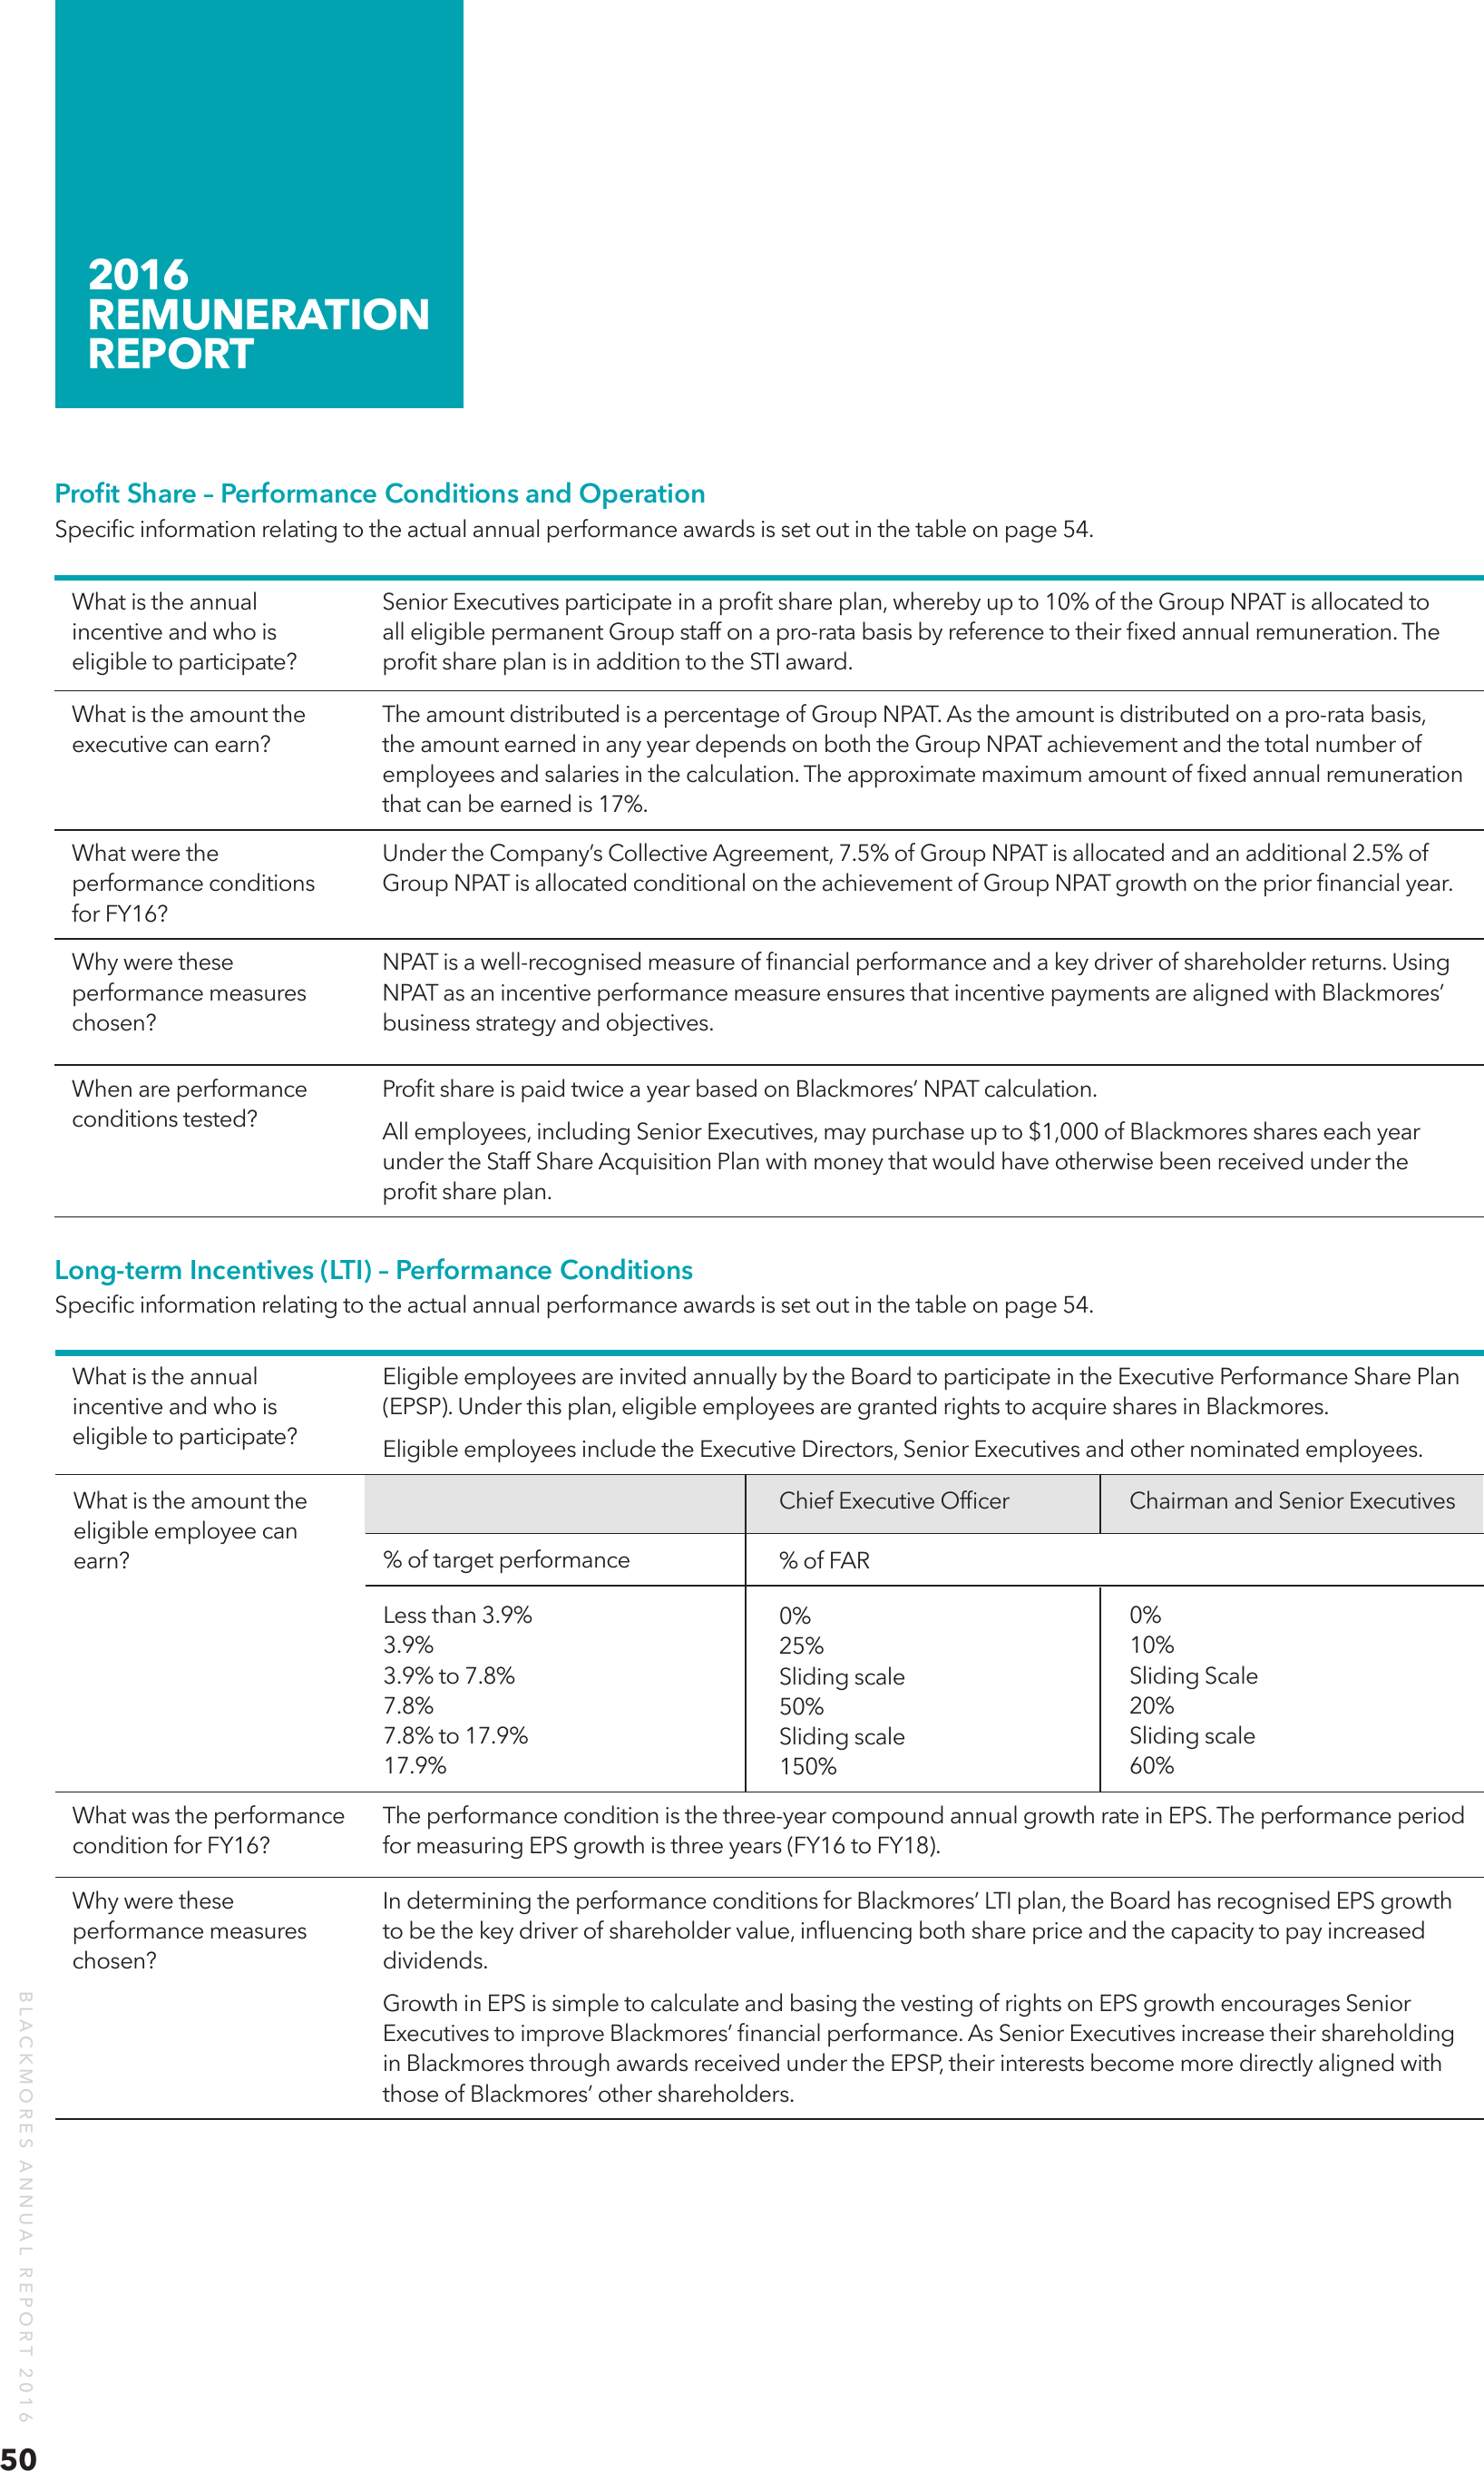
Profit Share – Performance Conditions and Operation
Specific information relating to the actual annual performance awards is set out in the table on page 54.
What is the annual
incentive and who is
eligible to participate?
Senior Executives participate in a profit share plan, whereby up to 10% of the Group NPAT is allocated to
all eligible permanent Group staff on a pro-rata basis by reference to their fixed annual remuneration. The
profit share plan is in addition to the STI award.
What is the amount the
executive can earn?
The amount distributed is a percentage of Group NPAT. As the amount is distributed on a pro-rata basis,
the amount earned in any year depends on both the Group NPAT achievement and the total number of
employees and salaries in the calculation. The approximate maximum amount of fixed annual remuneration
that can be earned is 17%.
What were the
performance conditions
for FY16?
Under the Company’s Collective Agreement, 7.5% of Group NPAT is allocated and an additional 2.5% of
Group NPAT is allocated conditional on the achievement of Group NPAT growth on the prior financial year.
Why were these
performance measures
chosen?
NPAT is a well-recognised measure of financial performance and a key driver of shareholder returns. Using
NPAT as an incentive performance measure ensures that incentive payments are aligned with Blackmores’
business strategy and objectives.
When are performance
conditions tested?
Profit share is paid twice a year based on Blackmores’ NPAT calculation.
All employees, including Senior Executives, may purchase up to $1,000 of Blackmores shares each year
under the Staff Share Acquisition Plan with money that would have otherwise been received under the
profit share plan.
Long-term Incentives (LTI) – Performance Conditions
Specific information relating to the actual annual performance awards is set out in the table on page 54.
What is the annual
incentive and who is
eligible to participate?
Eligible employees are invited annually by the Board to participate in the Executive Performance Share Plan
(EPSP). Under this plan, eligible employees are granted rights to acquire shares in Blackmores.
What is the amount the
eligible employee can
earn?
Chief Executive Officer
% of target performance
% of FAR
Less than 3.9%
3.9%
3.9% to 7.8%
7.8%
7.8% to 17.9%
17.9%
0%
25%
Sliding scale
50%
Sliding scale
150%
Eligible employees include the Executive Directors, Senior Executives and other nominated employees.
Chairman and Senior Executives
0%
10%
Sliding Scale
20%
Sliding scale
60%
What was the performance
condition for FY16?
Why were these
performance measures
chosen?
BLACKMORES ANNUAL REPORT 2016
50
The performance condition is the three-year compound annual growth rate in EPS. The performance period
for measuring EPS growth is three years (FY16 to FY18).
In determining the performance conditions for Blackmores’ LTI plan, the Board has recognised EPS growth
to be the key driver of shareholder value, influencing both share price and the capacity to pay increased
dividends.
Growth in EPS is simple to calculate and basing the vesting of rights on EPS growth encourages Senior
Executives to improve Blackmores’ financial performance. As Senior Executives increase their shareholding
in Blackmores through awards received under the EPSP, their interests become more directly aligned with
those of Blackmores’ other shareholders.
2016
REMUNERATION
REPORT
Long-term Incentives (LTI) – Performance Conditions
How does the EPSP
operate?
The value of rights granted to eligible employees is equivalent to a percentage of their base remuneration
at the time of grant.
The number of rights granted equals the value of rights divided by:
•
the weighted average price of Blackmores shares for the five day trading period commencing seven
days after Blackmores’ results in respect of the prior financial year (year ended 30 June 2015) are
announced to the ASX, less
•
the amount of any final dividend per share declared as payable in respect of the prior financial year
(year ended 30 June 2015).
Rights are automatically exercised following vesting, audit clearance of the 2018 Financial Statements, Board
approval and the first trading window. These Blackmores shares are issued to participants at zero cost.
The number of shares issued is identical to the number of rights exercised.
In the case of the Chairman, a cash equivalent is paid in lieu of shares. Where regulations prohibit an equity
based plan, a cash equivalent is awarded.
When are performance
conditions tested?
Compounded annual growth in EPS is calculated at the end of the three year performance period and
verified with reference to Blackmores’ audited Financial Statements prior to determining the number of
rights that will vest. This method was chosen as it is an objective test that is easy to calculate and ensures
transparency and consistency with public disclosures.
What happens if the
eligible employee ceases
employment during the
performance period?
If an executive ceases employment during the three year performance period the rights lapse. In certain
circumstances the board has discretion to allow a portion of rights to vest for a ‘good leaver‘.
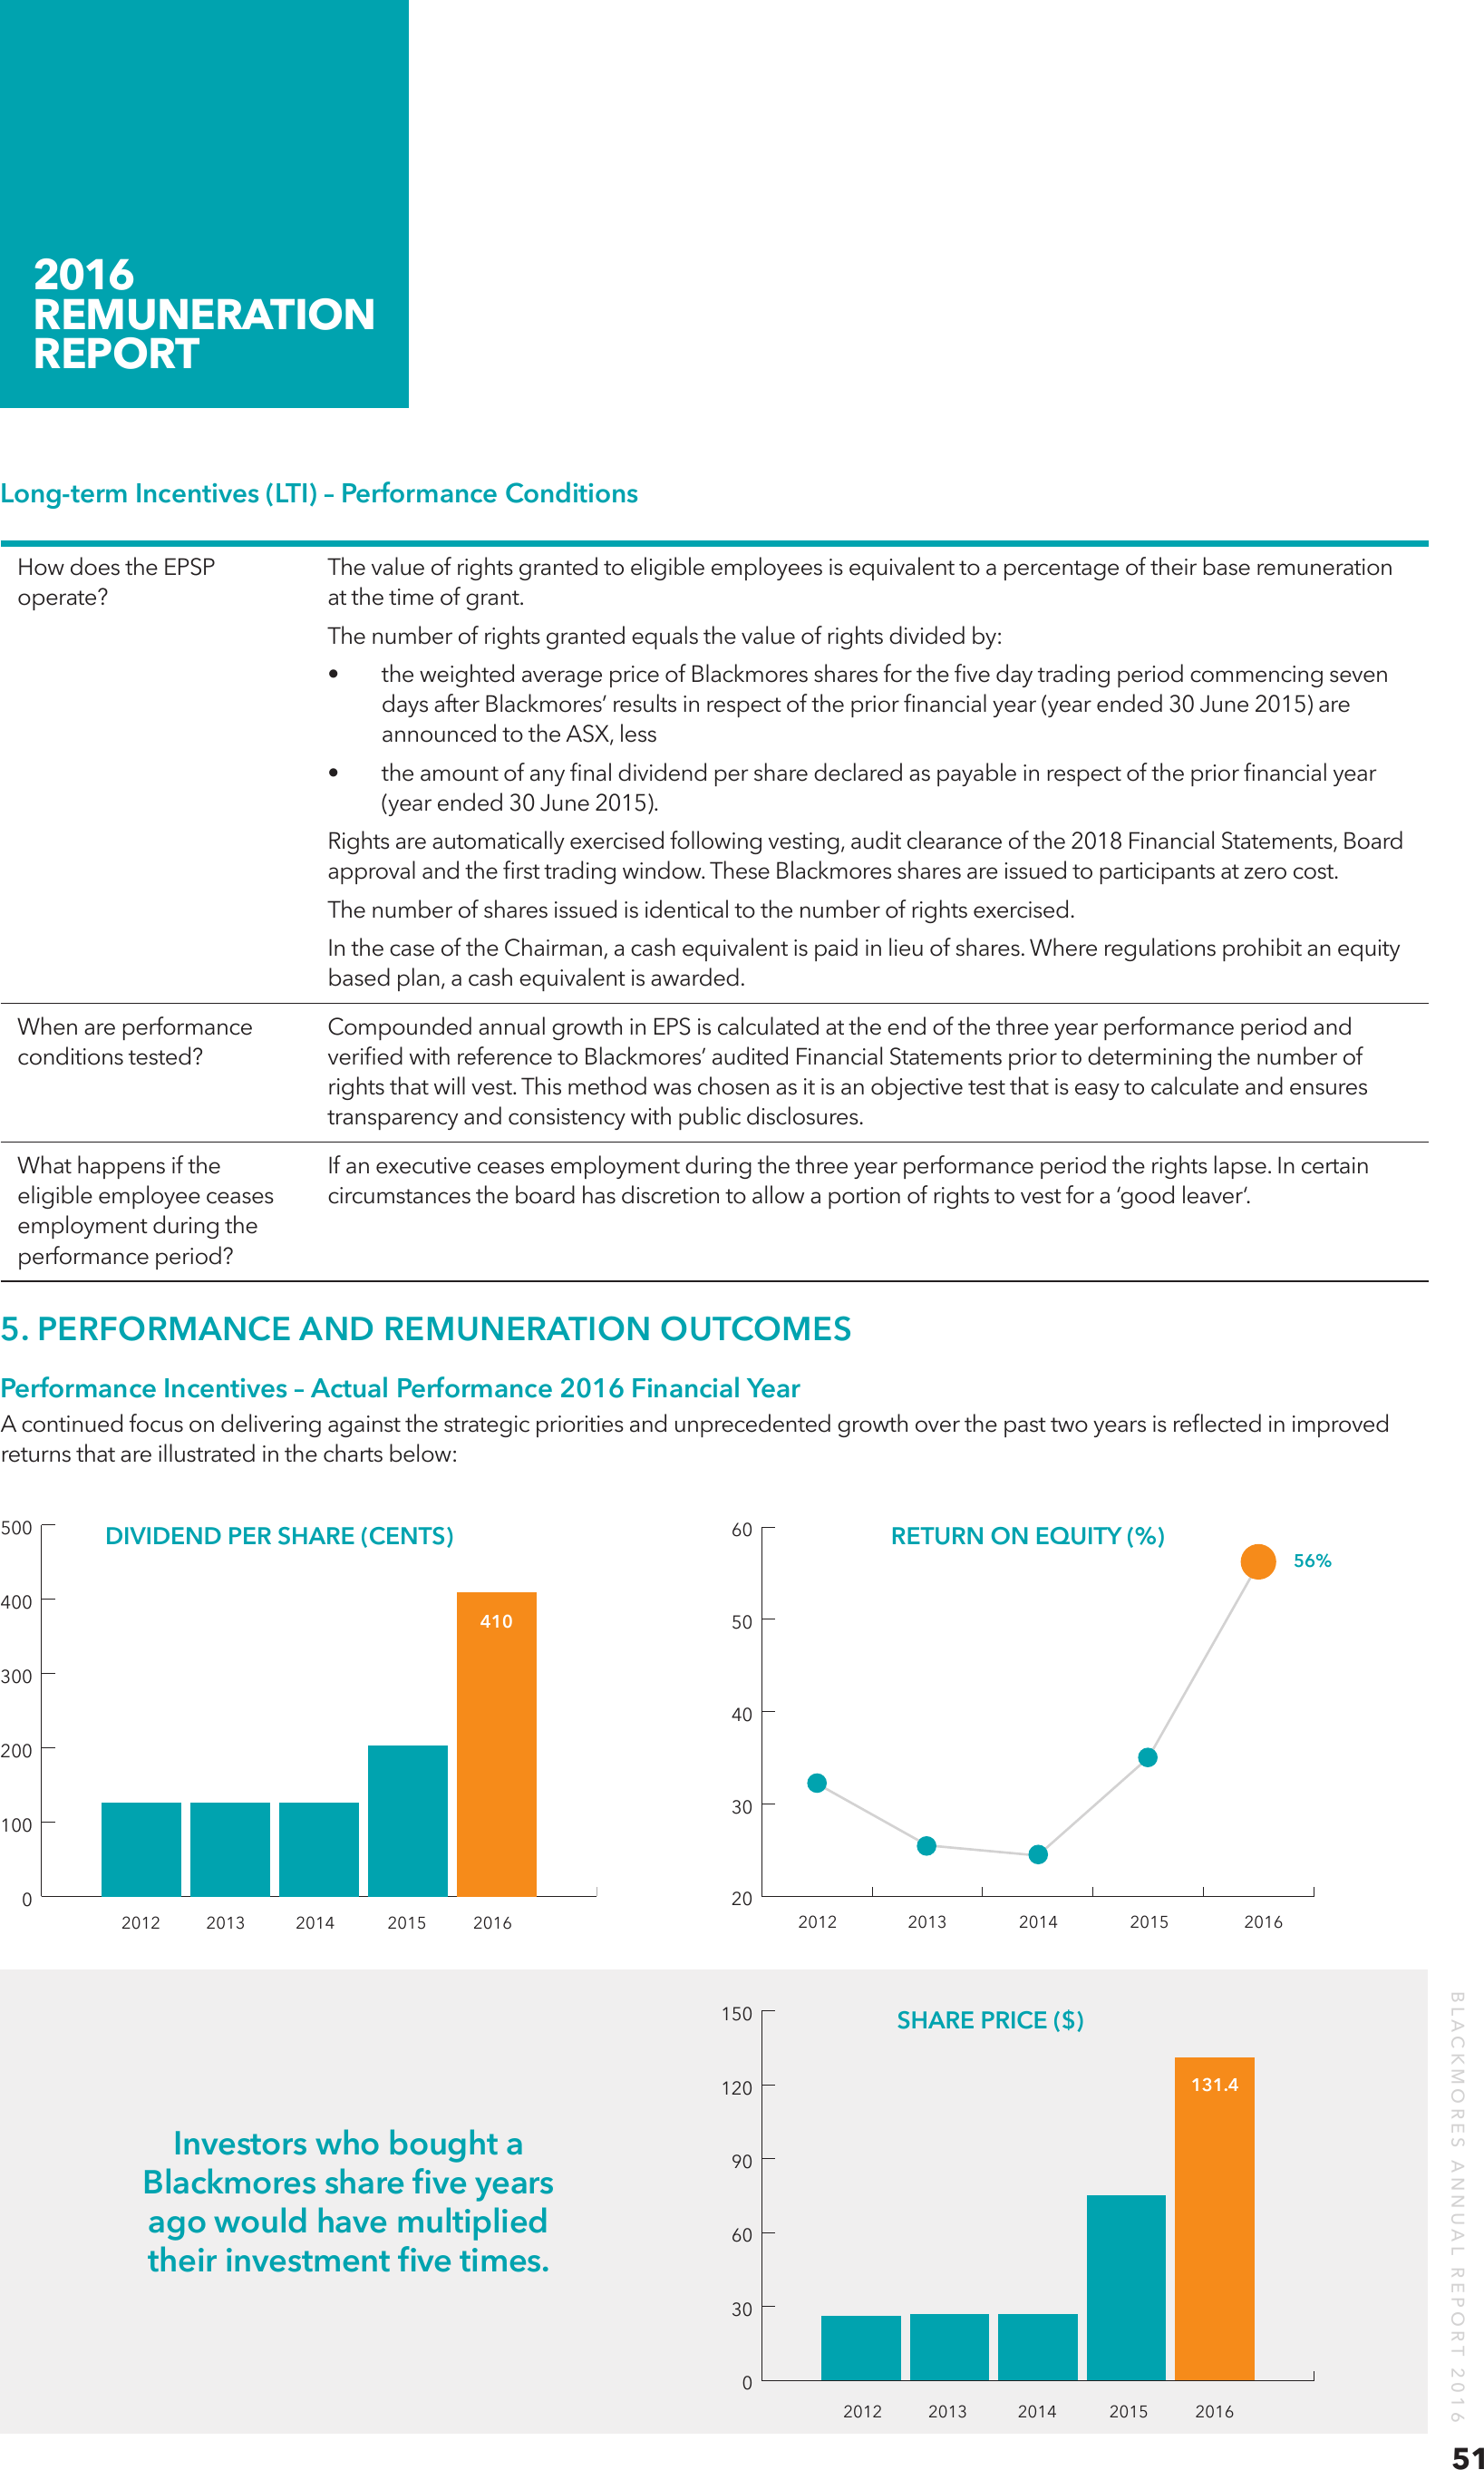
5. PERFORMANCE AND REMUNERATION OUTCOMES
Performance Incentives – Actual Performance 2016 Financial Year
A continued focus on delivering against the strategic priorities and unprecedented growth over the past two years is reflected in improved
returns that are illustrated in the charts below:
500
60
DIVIDEND PER SHARE (CENTS)
400
410
RETURN ON EQUITY (%)
56%
50
300
40
200
30
100
0
2012
2013
2014
2015
2016
20
2012
2013
2015
SHARE PRICE ($)
131.4
120
Investors who bought a
Blackmores share five years
ago would have multiplied
their investment five times.
2016
90
60
30
0
2012
2013
2014
2015
2016
BLACKMORES ANNUAL REPORT 2016
150
2014
51
2016
REMUNERATION
REPORT
100
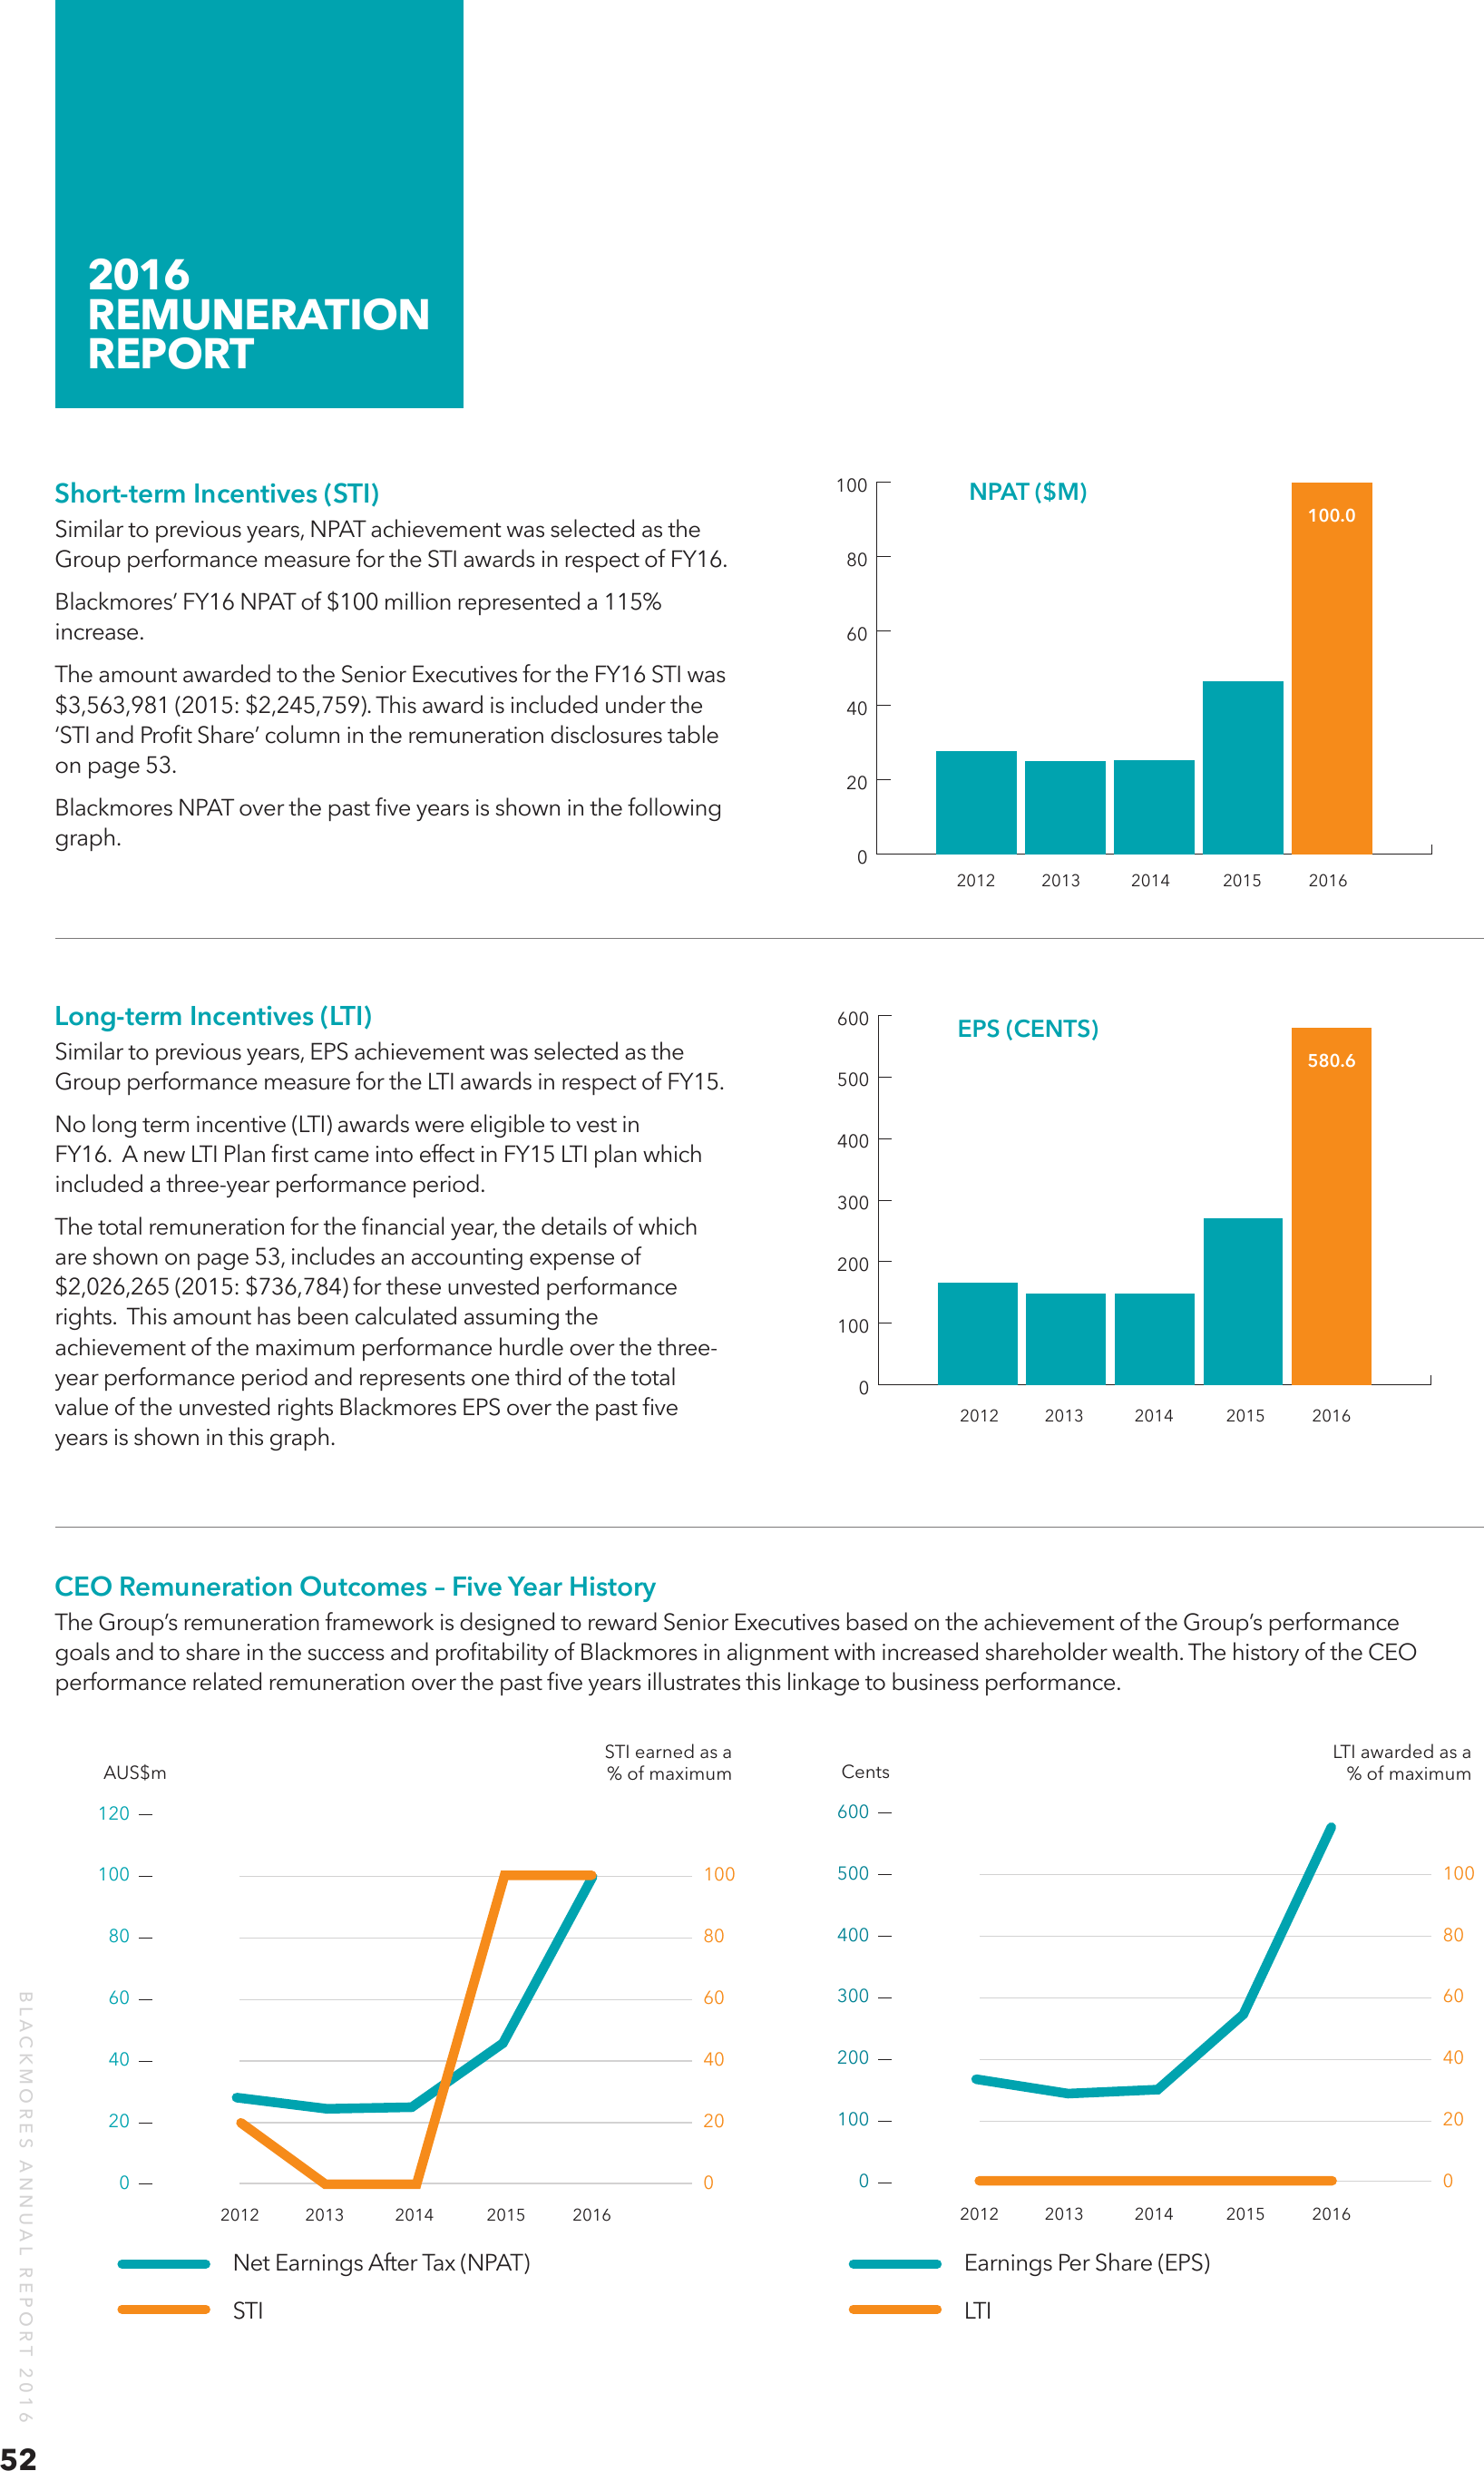
Short-term Incentives (STI)
Similar to previous years, NPAT achievement was selected as the
Group performance measure for the STI awards in respect of FY16.
100.0
80
Blackmores’ FY16 NPAT of $100 million represented a 115%
increase.
NPAT ($M)
60
The amount awarded to the Senior Executives for the FY16 STI was
$3,563,981 (2015: $2,245,759). This award is included under the
‘STI and Profit Share’ column in the remuneration disclosures table
on page 53.
Blackmores NPAT over the past five years is shown in the following
graph.
Long-term Incentives (LTI)
Similar to previous years, EPS achievement was selected as the
Group performance measure for the LTI awards in respect of FY15.
No long term incentive (LTI) awards were eligible to vest in
FY16. A new LTI Plan first came into effect in FY15 LTI plan which
included a three-year performance period.
40
20
0
600
2012
2013
2014
2015
EPS (CENTS)
2016
580.6
500
400
The total remuneration for the financial year, the details of which
are shown on page 53, includes an accounting expense of
$2,026,265 (2015: $736,784) for these unvested performance
rights. This amount has been calculated assuming the
achievement of the maximum performance hurdle over the threeyear performance period and represents one third of the total
value of the unvested rights Blackmores EPS over the past five
years is shown in this graph.
300
200
100
0
2012
2013
2014
2015
2016
CEO Remuneration Outcomes – Five Year History
The Group’s remuneration framework is designed to reward Senior Executives based on the achievement of the Group’s performance
goals and to share in the success and profitability of Blackmores in alignment with increased shareholder wealth. The history of the CEO
performance related remuneration over the past five years illustrates this linkage to business performance.
STI earned as a
% of maximum
AUS$m
LTI awarded as a
% of maximum
Cents
600
120
52
100
500
100
80
BLACKMORES ANNUAL REPORT 2016
100
80
400
80
60
60
300
60
40
40
200
40
20
20
100
20
0
0
2012
2013
2014
2015
2016
0
0
2012
2013
2014
Net Earnings After Tax (NPAT)
Earnings Per Share (EPS)
STI
LTI
2015
2016
2016
REMUNERATION
REPORT
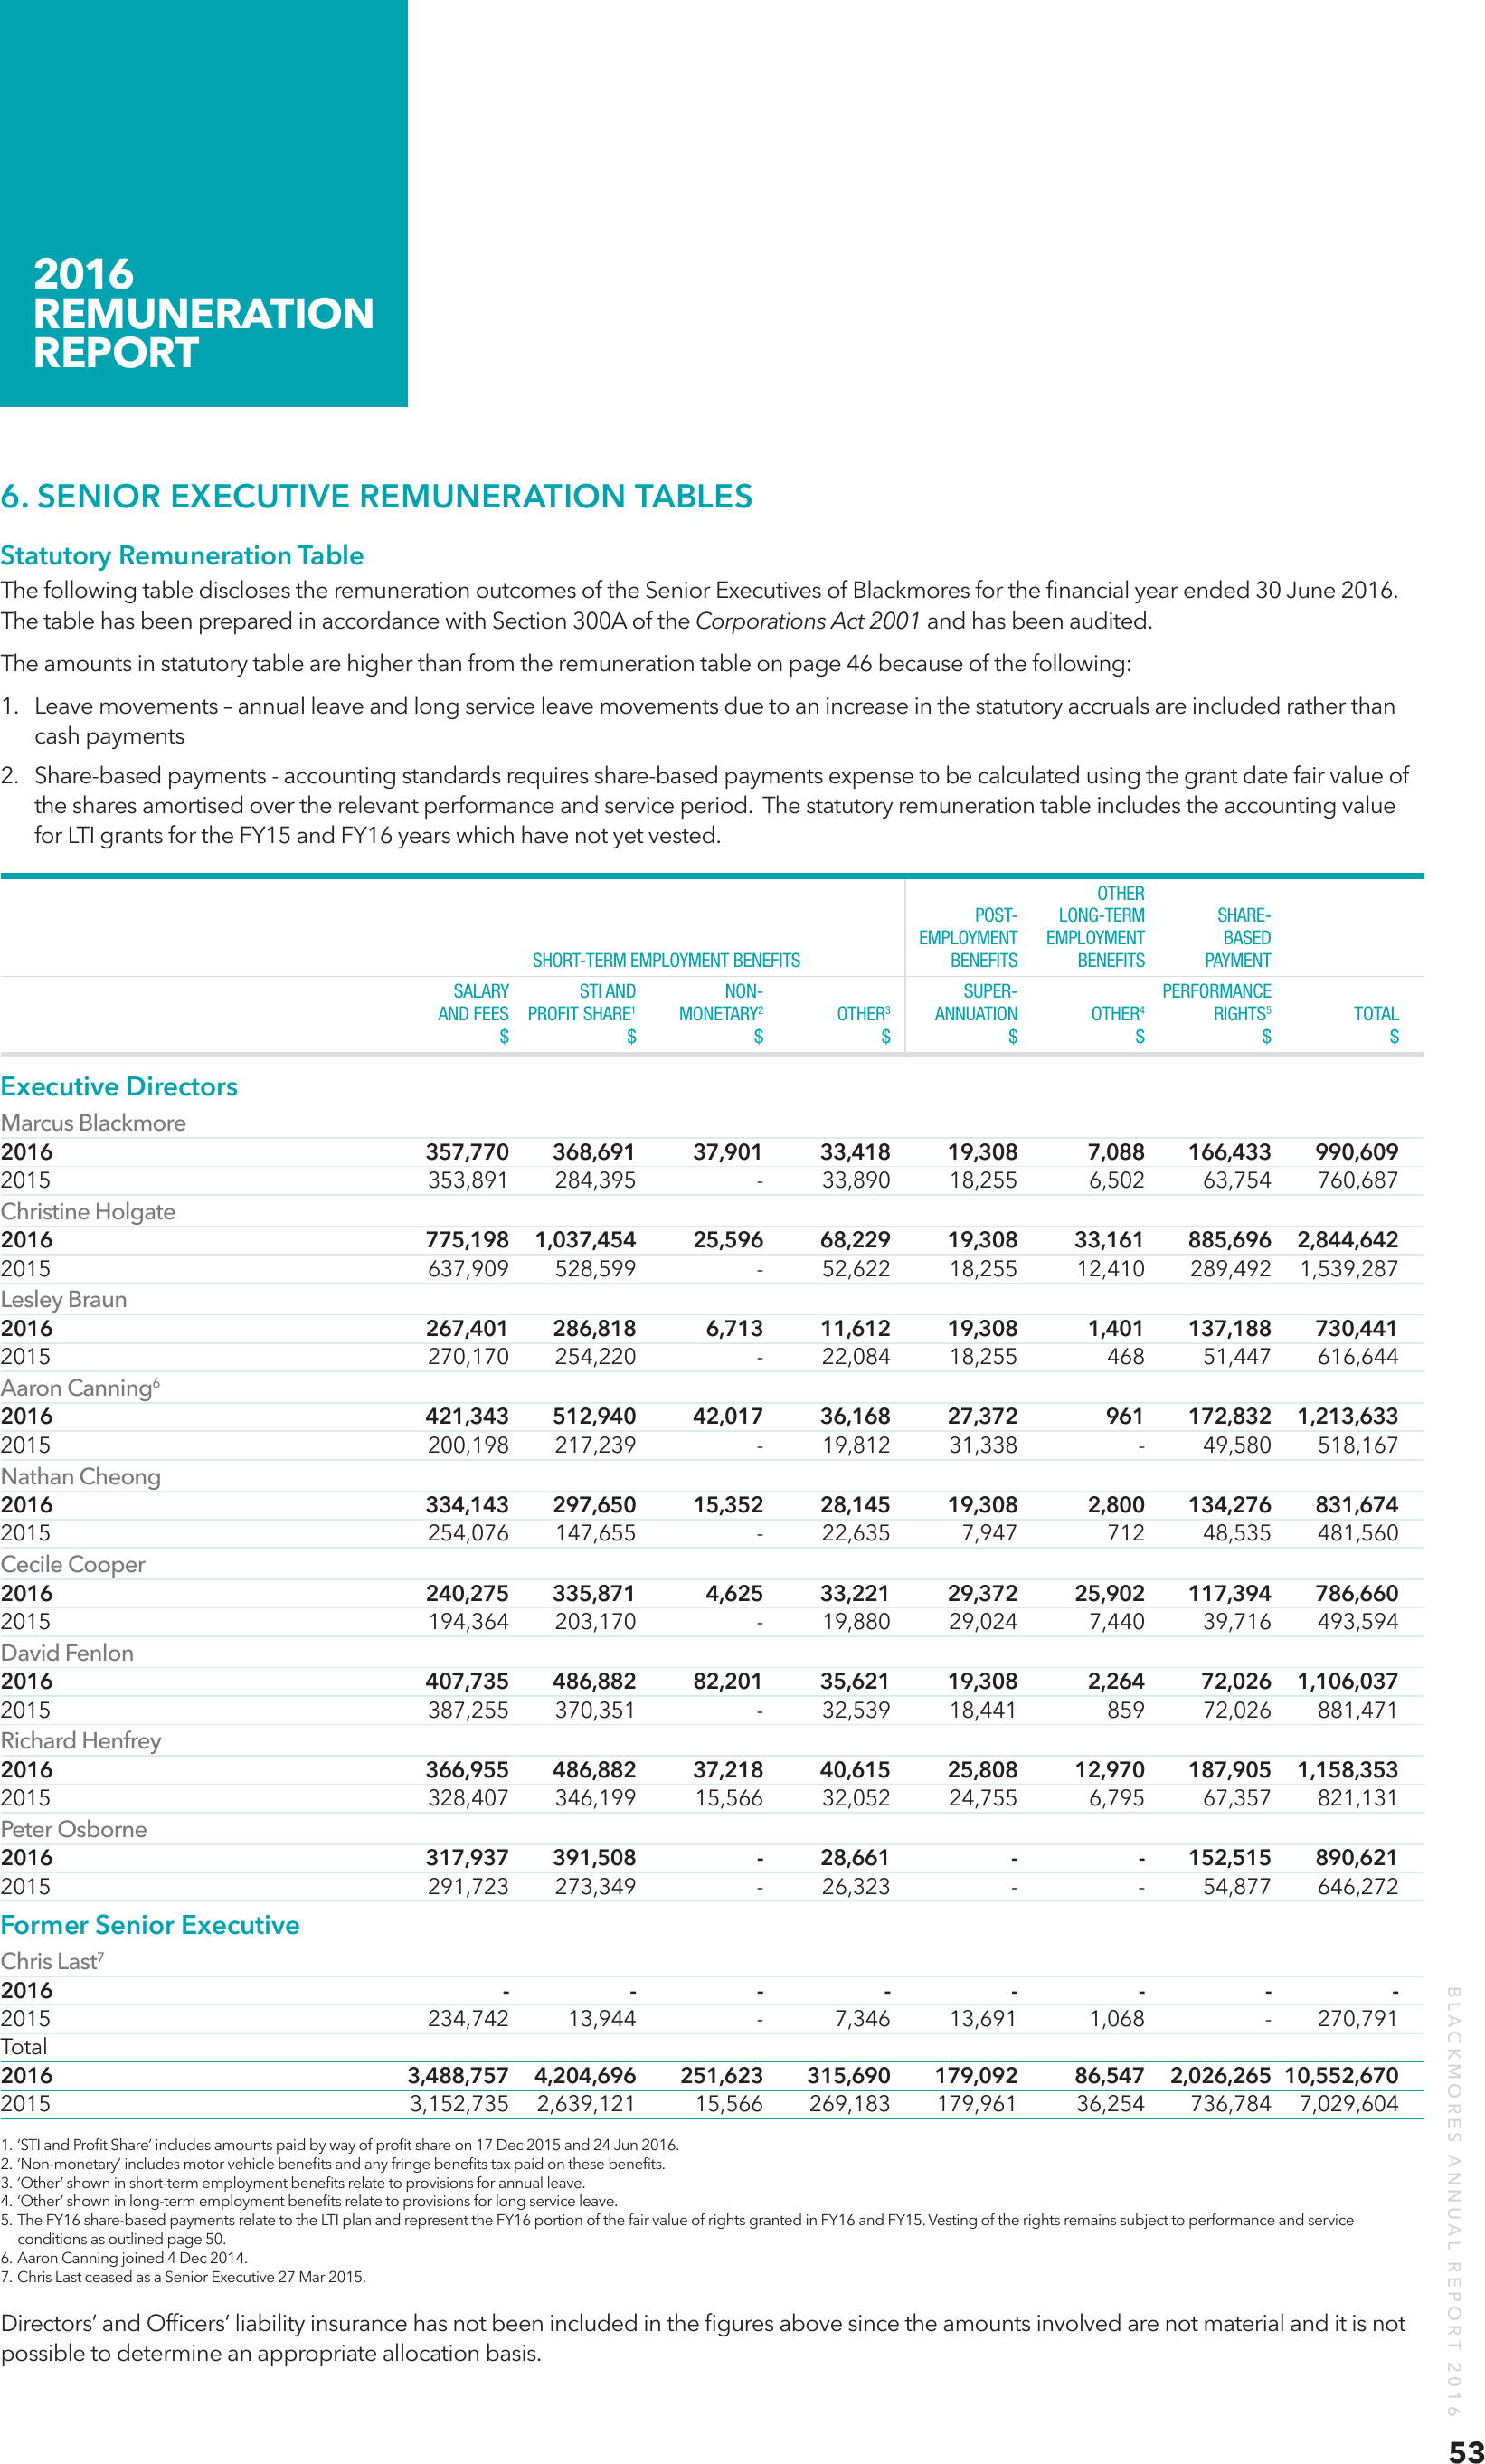
6. SENIOR EXECUTIVE REMUNERATION TABLES
Statutory Remuneration Table
The following table discloses the remuneration outcomes of the Senior Executives of Blackmores for the financial year ended 30 June 2016.
The table has been prepared in accordance with Section 300A of the Corporations Act 2001 and has been audited.
The amounts in statutory table are higher than from the remuneration table on page 46 because of the following:
1. Leave movements – annual leave and long service leave movements due to an increase in the statutory accruals are included rather than
cash payments
2. Share-based payments - accounting standards requires share-based payments expense to be calculated using the grant date fair value of
the shares amortised over the relevant performance and service period. The statutory remuneration table includes the accounting value
for LTI grants for the FY15 and FY16 years which have not yet vested.
OTHER
POST-
LONG-TERM
SHARE EMPLOYMENT EMPLOYMENT
BASED
SHORT-TERM EMPLOYMENT BENEFITS
BENEFITS
BENEFITS
PAYMENT
SALARY
STI AND
NON-
SUPER-
PERFORMANCE
AND FEES PROFIT SHARE1 MONETARY2 OTHER3 ANNUATION OTHER4 RIGHTS5
TOTAL
$ $ $ $ $ $ $ $
Executive Directors
Marcus Blackmore
2016
357,770
368,691
37,901
33,418
19,308
7,088 166,433 990,609
2015
353,891
284,395
-
33,890
18,255
6,502
63,754
760,687
Christine Holgate
2016
775,198 1,037,454
25,596
68,229
19,308
33,161 885,696 2,844,642
2015
637,909
528,599
- 52,622 18,255 12,410
289,492
1,539,287
Lesley Braun
2016
267,401
286,818
6,713
11,612
19,308
1,401 137,188 730,441
2015
270,170
254,220
-
22,084
18,255
468
51,447
616,644
Aaron Canning6
2016
421,343
512,940
42,017
36,168
27,372
961 172,832 1,213,633
2015
200,198
217,239
-
19,812
31,338
-
49,580
518,167
Nathan Cheong
2016
334,143
297,650
15,352
28,145
19,308
2,800 134,276 831,674
2015
254,076
147,655
-
22,635
7,947
712
48,535
481,560
Cecile Cooper
2016
240,275
335,871
4,625
33,221
29,372
25,902 117,394 786,660
2015
194,364
203,170
-
19,880
29,024
7,440
39,716
493,594
David Fenlon
2016
407,735
486,882
82,201
35,621
19,308
2,264
72,026 1,106,037
2015
387,255
370,351
-
32,539
18,441
859
72,026
881,471
Richard Henfrey
2016
366,955
486,882
37,218
40,615
25,808
12,970 187,905 1,158,353
2015
328,407
346,199
15,566
32,052
24,755
6,795
67,357
821,131
Peter Osborne
2016
317,937
391,508
-
28,661
-
-
152,515 890,621
2015
291,723
273,349
-
26,323
-
-
54,877
646,272
Former Senior Executive
1. ‘STI and Profit Share’ includes amounts paid by way of profit share on 17 Dec 2015 and 24 Jun 2016.
2. ‘Non-monetary’ includes motor vehicle benefits and any fringe benefits tax paid on these benefits.
3. ‘Other’ shown in short-term employment benefits relate to provisions for annual leave.
4. ‘Other’ shown in long-term employment benefits relate to provisions for long service leave.
5. The FY16 share-based payments relate to the LTI plan and represent the FY16 portion of the fair value of rights granted in FY16 and FY15. Vesting of the rights remains subject to performance and service
conditions as outlined page 50.
6. Aaron Canning joined 4 Dec 2014.
7. Chris Last ceased as a Senior Executive 27 Mar 2015.
Directors’ and Officers’ liability insurance has not been included in the figures above since the amounts involved are not material and it is not
possible to determine an appropriate allocation basis.
BLACKMORES ANNUAL REPORT 2016
Chris Last7
2016
- - - - - - - 2015
234,742
13,944
-
7,346
13,691
1,068
-
270,791
Total
2016
3,488,757
4,204,696 251,623 315,690 179,092 86,547
2,026,265
10,552,670
2015
3,152,735
2,639,121 15,566 269,183 179,961 36,254 736,784
7,029,604
53
2016
REMUNERATION
REPORT
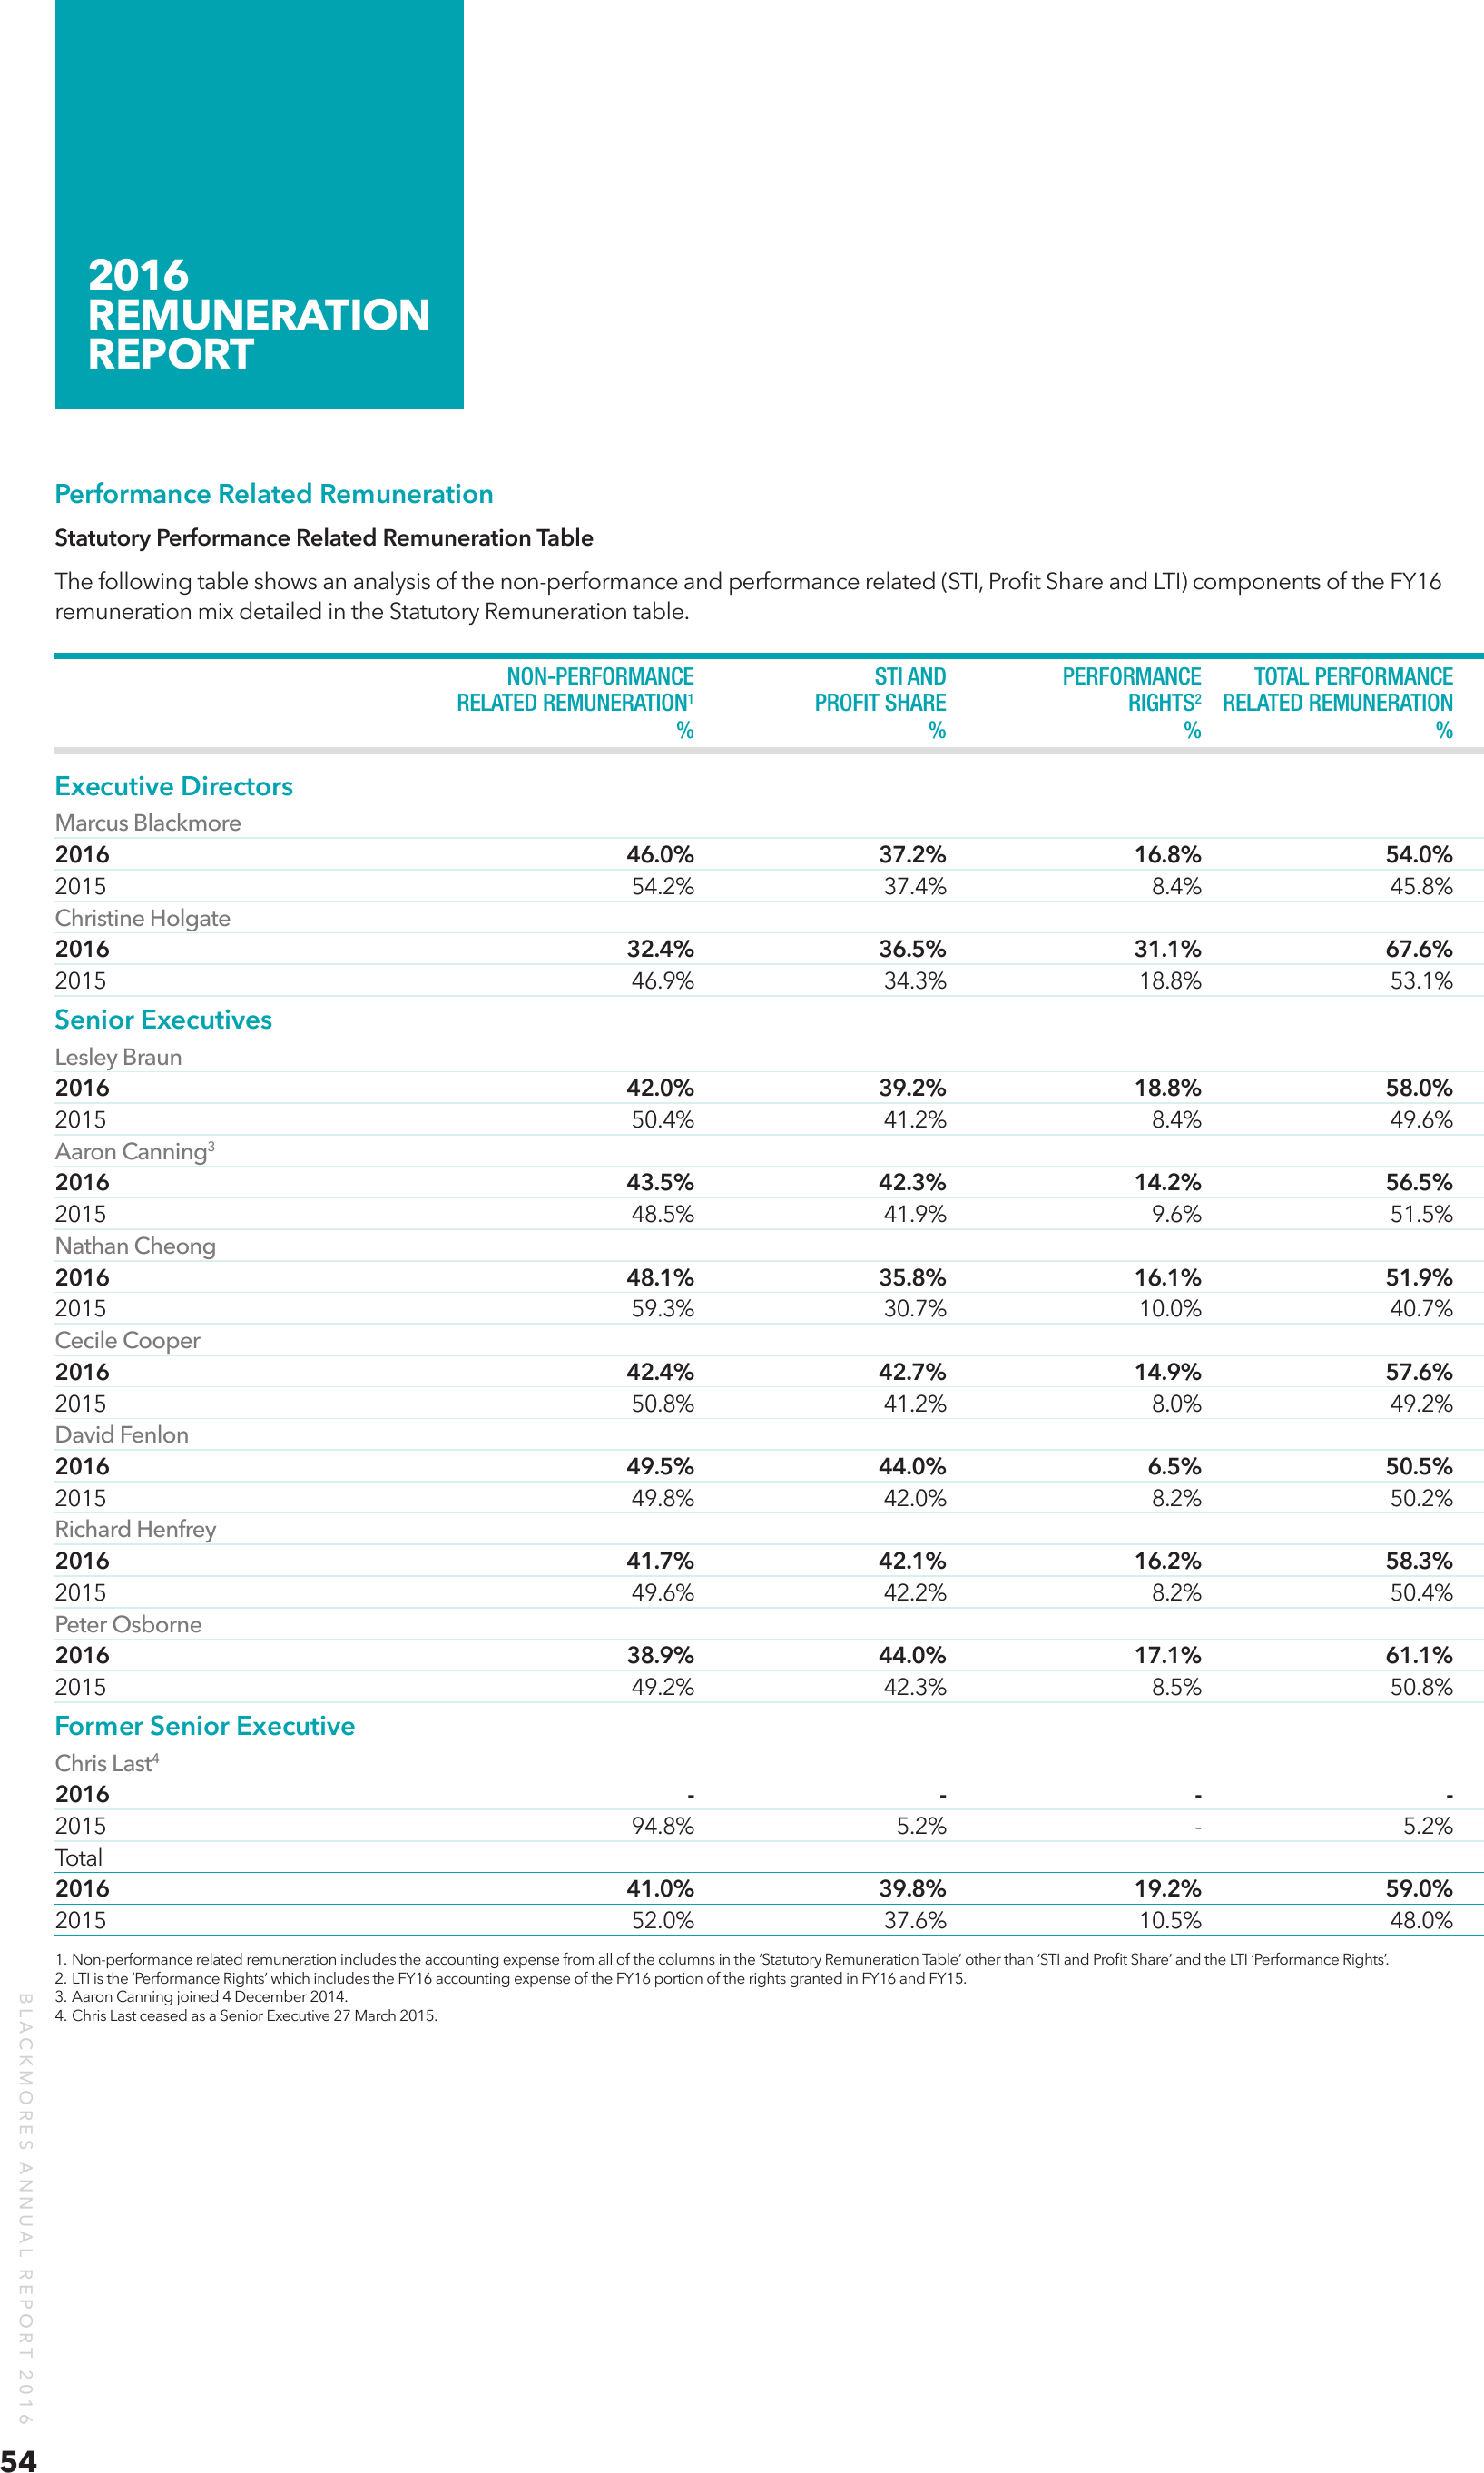
Performance Related Remuneration
Statutory Performance Related Remuneration Table
The following table shows an analysis of the non-performance and performance related (STI, Profit Share and LTI) components of the FY16
remuneration mix detailed in the Statutory Remuneration table.
NON-PERFORMANCE
STI AND
PERFORMANCE
TOTAL PERFORMANCE
RELATED REMUNERATION1
PROFIT SHARE
RIGHTS2 RELATED REMUNERATION
% % % %
Executive Directors
Marcus Blackmore
2016
46.0% 37.2% 16.8% 54.0%
2015
54.2% 37.4% 8.4% 45.8%
Christine Holgate
2016
32.4% 36.5% 31.1% 67.6%
2015
46.9% 34.3% 18.8% 53.1%
Senior Executives
Lesley Braun
2016
42.0% 39.2% 18.8% 58.0%
2015
50.4% 41.2% 8.4% 49.6%
Aaron Canning3
2016
43.5% 42.3% 14.2% 56.5%
2015
48.5% 41.9% 9.6% 51.5%
Nathan Cheong
2016
48.1% 35.8% 16.1% 51.9%
2015
59.3% 30.7% 10.0% 40.7%
Cecile Cooper
2016
42.4% 42.7% 14.9% 57.6%
2015
50.8% 41.2% 8.0% 49.2%
David Fenlon
2016
49.5% 44.0% 6.5% 50.5%
2015
49.8% 42.0% 8.2% 50.2%
Richard Henfrey
2016
41.7% 42.1% 16.2% 58.3%
2015
49.6% 42.2% 8.2% 50.4%
Peter Osborne
2016
38.9% 44.0% 17.1% 61.1%
2015
49.2% 42.3% 8.5% 50.8%
Former Senior Executive
Chris Last4
2016
- - - 2015
94.8% 5.2%
- 5.2%
Total
2016
41.0% 39.8% 19.2% 59.0%
2015
52.0% 37.6% 10.5% 48.0%
BLACKMORES ANNUAL REPORT 2016
54
1. Non-performance related remuneration includes the accounting expense from all of the columns in the ‘Statutory Remuneration Table’ other than ‘STI and Profit Share’ and the LTI ‘Performance Rights’.
2. LTI is the ‘Performance Rights’ which includes the FY16 accounting expense of the FY16 portion of the rights granted in FY16 and FY15.
3. Aaron Canning joined 4 December 2014.
4. Chris Last ceased as a Senior Executive 27 March 2015.
2016
REMUNERATION
REPORT
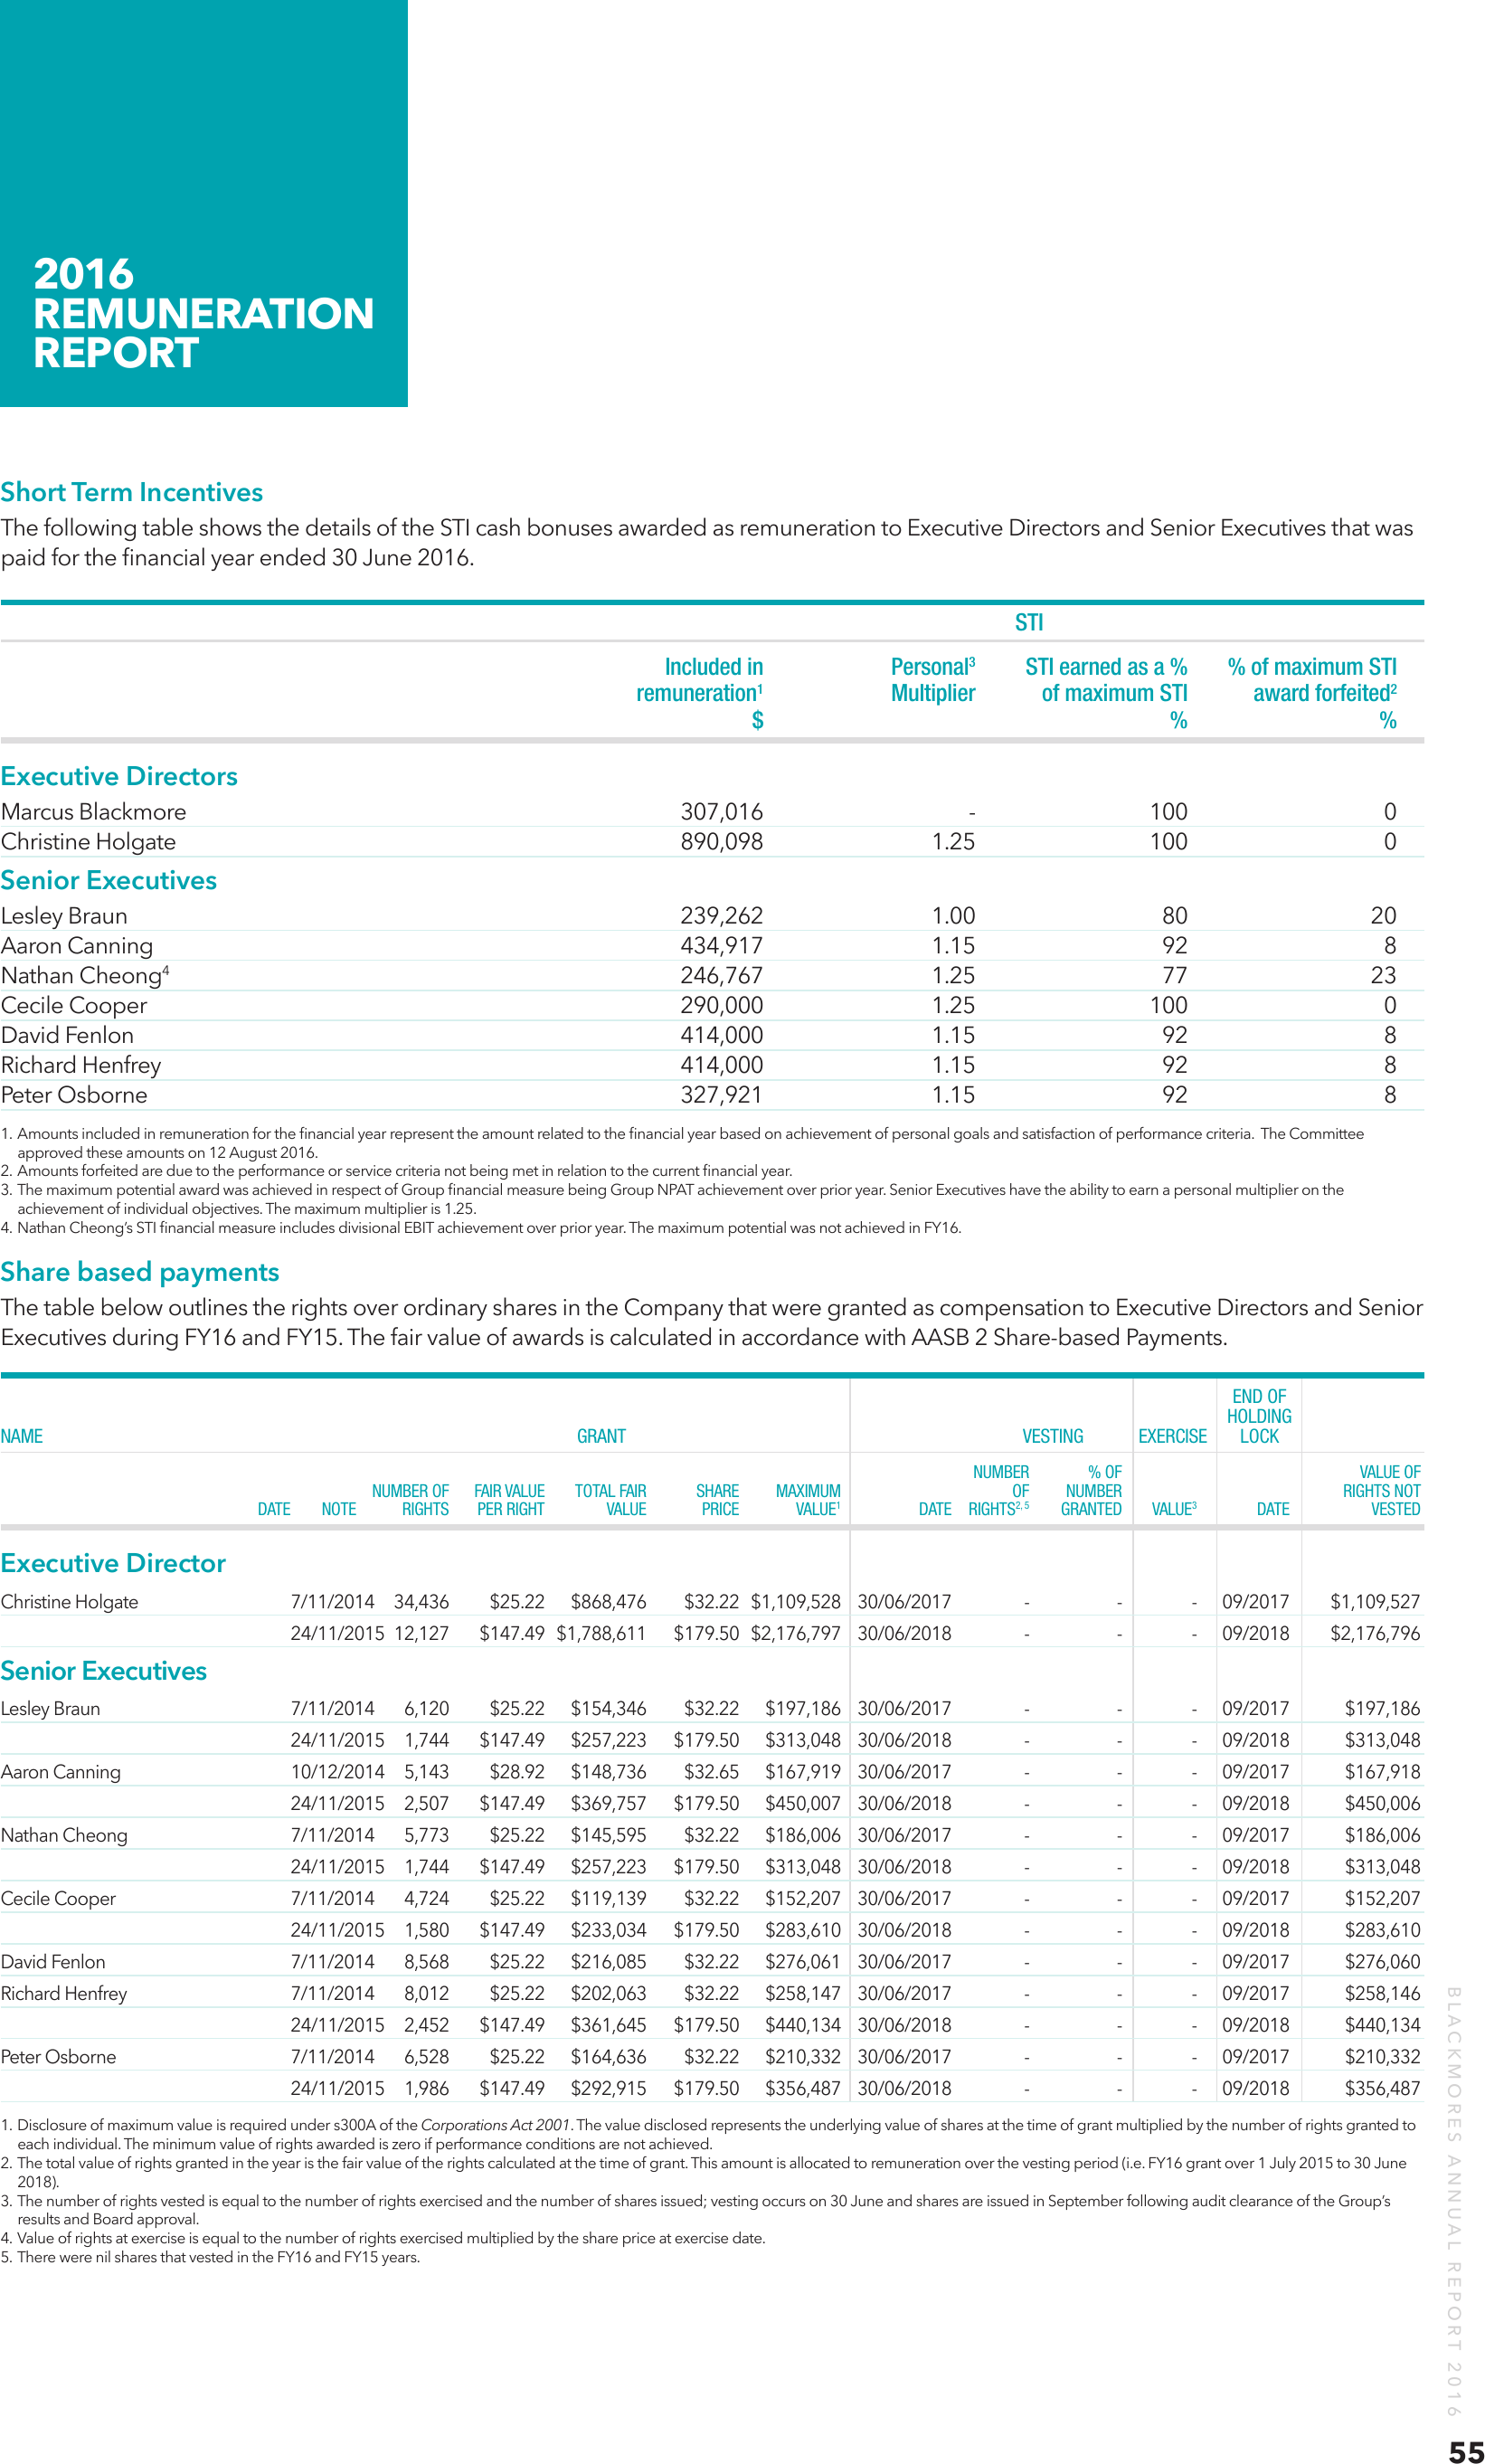
Short Term Incentives
The following table shows the details of the STI cash bonuses awarded as remuneration to Executive Directors and Senior Executives that was
paid for the financial year ended 30 June 2016.
STI
Included in
Personal
STI earned as a % % of maximum STI
remuneration1
Multiplier
of maximum STI
award forfeited2
$ % %
3
Executive Directors
Marcus Blackmore
Christine Holgate
307,016
890,098
-
1.25
100
100
0
0
Lesley Braun
Aaron Canning
Nathan Cheong4
Cecile Cooper
David Fenlon
Richard Henfrey
Peter Osborne
239,262
434,917
246,767
290,000
414,000
414,000
327,921
1.00
1.15
1.25
1.25
1.15
1.15
1.15
80
92
77
100
92
92
92
20
8
23
0
8
8
8
Senior Executives
1. Amounts included in remuneration for the financial year represent the amount related to the financial year based on achievement of personal goals and satisfaction of performance criteria. The Committee
approved these amounts on 12 August 2016.
2. Amounts forfeited are due to the performance or service criteria not being met in relation to the current financial year.
3. The maximum potential award was achieved in respect of Group financial measure being Group NPAT achievement over prior year. Senior Executives have the ability to earn a personal multiplier on the
achievement of individual objectives. The maximum multiplier is 1.25.
4. Nathan Cheong’s STI financial measure includes divisional EBIT achievement over prior year. The maximum potential was not achieved in FY16.
Share based payments
The table below outlines the rights over ordinary shares in the Company that were granted as compensation to Executive Directors and Senior
Executives during FY16 and FY15. The fair value of awards is calculated in accordance with AASB 2 Share-based Payments.
END OF
HOLDING
NAME
GRANT
VESTING EXERCISE LOCK
NUMBER
NUMBER OF
DATE
NOTE
RIGHTS
FAIR VALUE
PER RIGHT
TOTAL FAIR
VALUE
SHARE
PRICE
% OF
VALUE OF
MAXIMUM
OF
NUMBER
RIGHTS NOT
VALUE1
DATE RIGHTS2, 5 GRANTED VALUE3 DATE VESTED
Executive Director
Christine Holgate
7/11/2014 34,436
24/11/2015 12,127
$868,476
$32.22 $1,109,528 30/06/2017
-
-
- 09/2017
$1,109,527
$147.49 $1,788,611
$25.22
$179.50 $2,176,797 30/06/2018
-
-
- 09/2018
$2,176,796
$197,186
Senior Executives
Lesley Braun
7/11/2014
6,120
$25.22
$154,346
$32.22
$197,186 30/06/2017
-
-
- 09/2017
24/11/2015 1,744
$147.49
$257,223
$179.50
$313,048 30/06/2018
-
-
- 09/2018
$313,048
Aaron Canning
10/12/2014 5,143
$28.92
$148,736
$32.65
$167,919 30/06/2017
-
-
- 09/2017
$167,918
24/11/2015 2,507
$147.49
$369,757
$179.50
$450,007 30/06/2018
-
-
- 09/2018
$450,006
5,773
$25.22
$145,595
$32.22
$186,006 30/06/2017
-
-
- 09/2017
$186,006
24/11/2015 1,744
Nathan Cheong
7/11/2014
$257,223
$179.50
$313,048 30/06/2018
-
-
- 09/2018
$313,048
$25.22
$119,139
$32.22
$152,207 30/06/2017
-
-
- 09/2017
$152,207
24/11/2015 1,580
$147.49
$233,034
$179.50
$283,610 30/06/2018
-
-
- 09/2018
$283,610
$25.22
$216,085
$32.22
$276,061 30/06/2017
-
-
- 09/2017
$276,060
$258,146
David Fenlon
7/11/2014
8,568
Richard Henfrey
7/11/2014
8,012
$25.22
$202,063
$32.22
$258,147 30/06/2017
-
-
- 09/2017
24/11/2015 2,452
$147.49
$361,645
$179.50
$440,134 30/06/2018
-
-
- 09/2018
$440,134
6,528
$25.22
$164,636
$32.22
$210,332 30/06/2017
-
-
- 09/2017
$210,332
24/11/2015 1,986
$147.49
$292,915
$179.50
$356,487 30/06/2018
-
-
- 09/2018
$356,487
Peter Osborne
7/11/2014
1. Disclosure of maximum value is required under s300A of the Corporations Act 2001. The value disclosed represents the underlying value of shares at the time of grant multiplied by the number of rights granted to
each individual. The minimum value of rights awarded is zero if performance conditions are not achieved.
2. The total value of rights granted in the year is the fair value of the rights calculated at the time of grant. This amount is allocated to remuneration over the vesting period (i.e. FY16 grant over 1 July 2015 to 30 June
2018).
3. The number of rights vested is equal to the number of rights exercised and the number of shares issued; vesting occurs on 30 June and shares are issued in September following audit clearance of the Group’s
results and Board approval.
4. Value of rights at exercise is equal to the number of rights exercised multiplied by the share price at exercise date.
5. There were nil shares that vested in the FY16 and FY15 years.
BLACKMORES ANNUAL REPORT 2016
$147.49
4,724
Cecile Cooper
7/11/2014
55
2016
REMUNERATION
REPORT
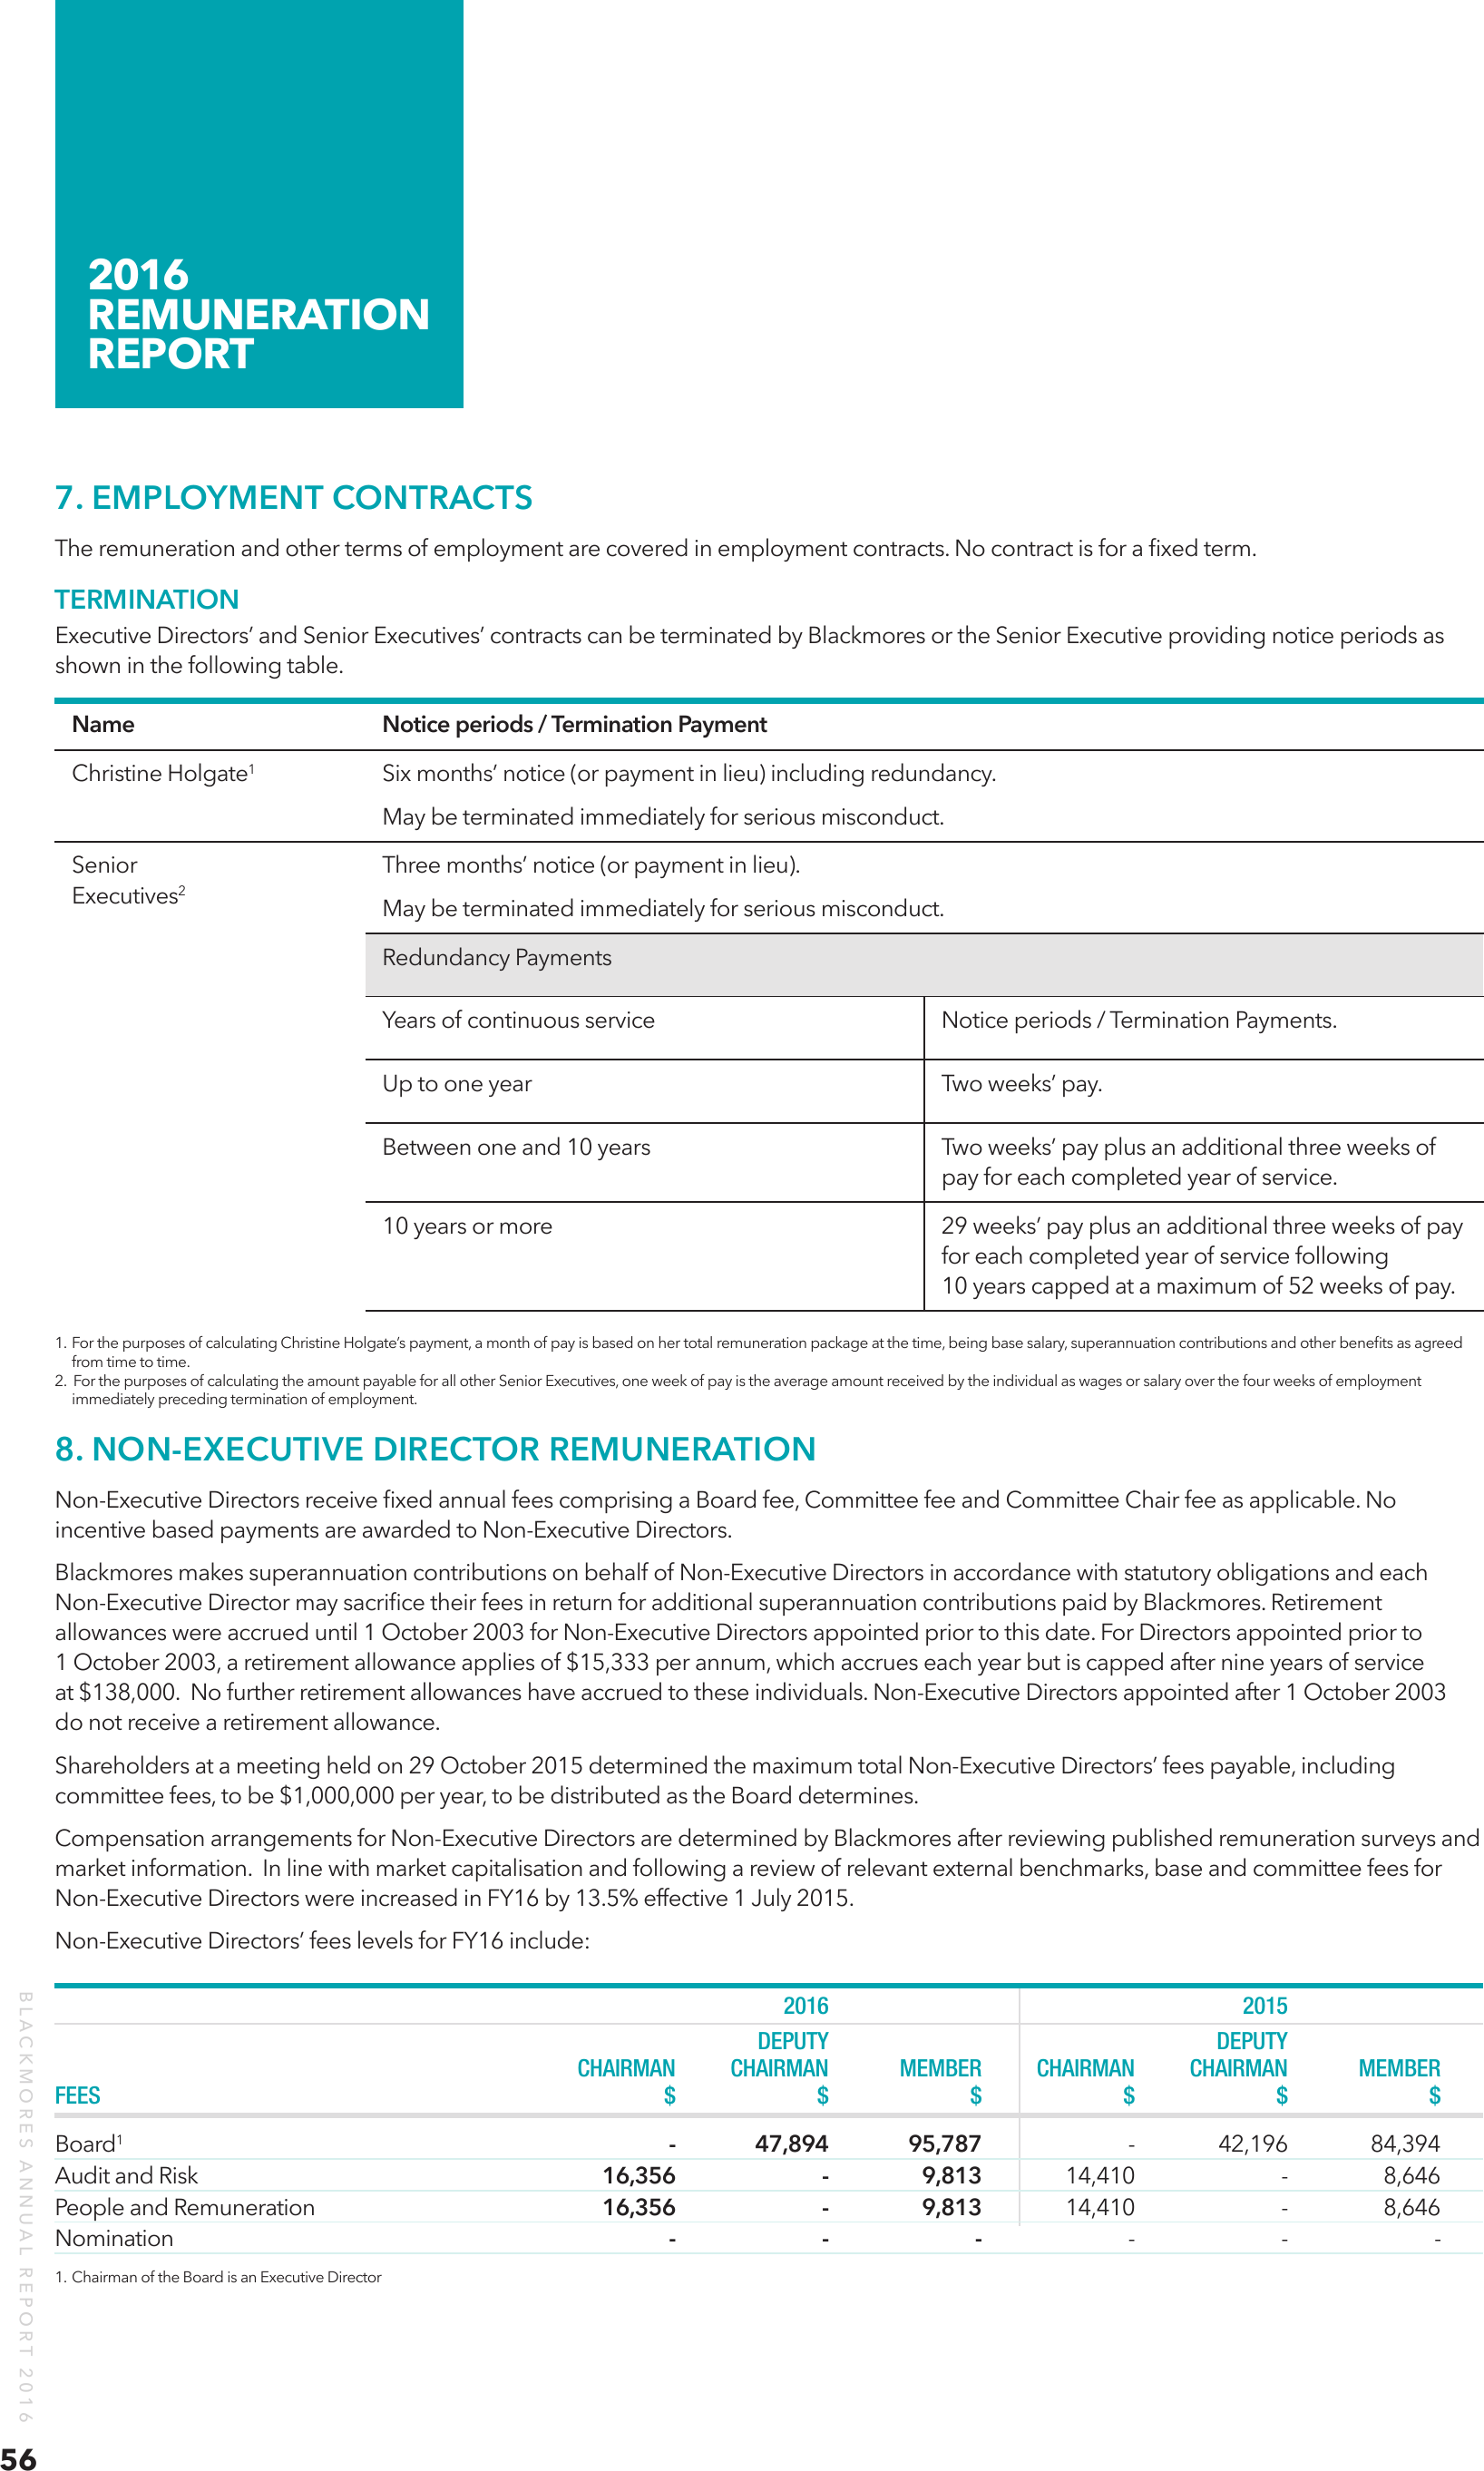
7. EMPLOYMENT CONTRACTS
The remuneration and other terms of employment are covered in employment contracts. No contract is for a fixed term.
TERMINATION
Executive Directors’ and Senior Executives’ contracts can be terminated by Blackmores or the Senior Executive providing notice periods as
shown in the following table.
Name
Notice periods / Termination Payment
Christine Holgate
1
Six months’ notice (or payment in lieu) including redundancy.
May be terminated immediately for serious misconduct.
Senior
Executives2
Three months’ notice (or payment in lieu).
May be terminated immediately for serious misconduct.
Redundancy Payments
Years of continuous service
Notice periods / Termination Payments.
Up to one year
Two weeks’ pay.
Between one and 10 years
Two weeks’ pay plus an additional three weeks of
pay for each completed year of service.
10 years or more
29 weeks’ pay plus an additional three weeks of pay
for each completed year of service following
10 years capped at a maximum of 52 weeks of pay.
1. For the purposes of calculating Christine Holgate’s payment, a month of pay is based on her total remuneration package at the time, being base salary, superannuation contributions and other benefits as agreed
from time to time.
2. For the purposes of calculating the amount payable for all other Senior Executives, one week of pay is the average amount received by the individual as wages or salary over the four weeks of employment
immediately preceding termination of employment.
8. NON-EXECUTIVE DIRECTOR REMUNERATION
Non-Executive Directors receive fixed annual fees comprising a Board fee, Committee fee and Committee Chair fee as applicable. No
incentive based payments are awarded to Non-Executive Directors.
Blackmores makes superannuation contributions on behalf of Non-Executive Directors in accordance with statutory obligations and each
Non-Executive Director may sacrifice their fees in return for additional superannuation contributions paid by Blackmores. Retirement
allowances were accrued until 1 October 2003 for Non-Executive Directors appointed prior to this date. For Directors appointed prior to
1 October 2003, a retirement allowance applies of $15,333 per annum, which accrues each year but is capped after nine years of service
at $138,000. No further retirement allowances have accrued to these individuals. Non-Executive Directors appointed after 1 October 2003
do not receive a retirement allowance.
Shareholders at a meeting held on 29 October 2015 determined the maximum total Non-Executive Directors’ fees payable, including
committee fees, to be $1,000,000 per year, to be distributed as the Board determines.
Compensation arrangements for Non-Executive Directors are determined by Blackmores after reviewing published remuneration surveys and
market information. In line with market capitalisation and following a review of relevant external benchmarks, base and committee fees for
Non-Executive Directors were increased in FY16 by 13.5% effective 1 July 2015.
Non-Executive Directors’ fees levels for FY16 include:
BLACKMORES ANNUAL REPORT 2016
56
2016
2015
DEPUTY
DEPUTY
CHAIRMAN CHAIRMAN MEMBER CHAIRMAN CHAIRMAN MEMBER
FEES $ $ $ $ $ $
Board1
Audit and Risk
People and Remuneration
Nomination
1. Chairman of the Board is an Executive Director
- 47,894 95,787
- 42,196 84,394
16,356
- 9,813 14,410
- 8,646
16,356
- 9,813 14,410
- 8,646
- - - - - -
2016
REMUNERATION
REPORT
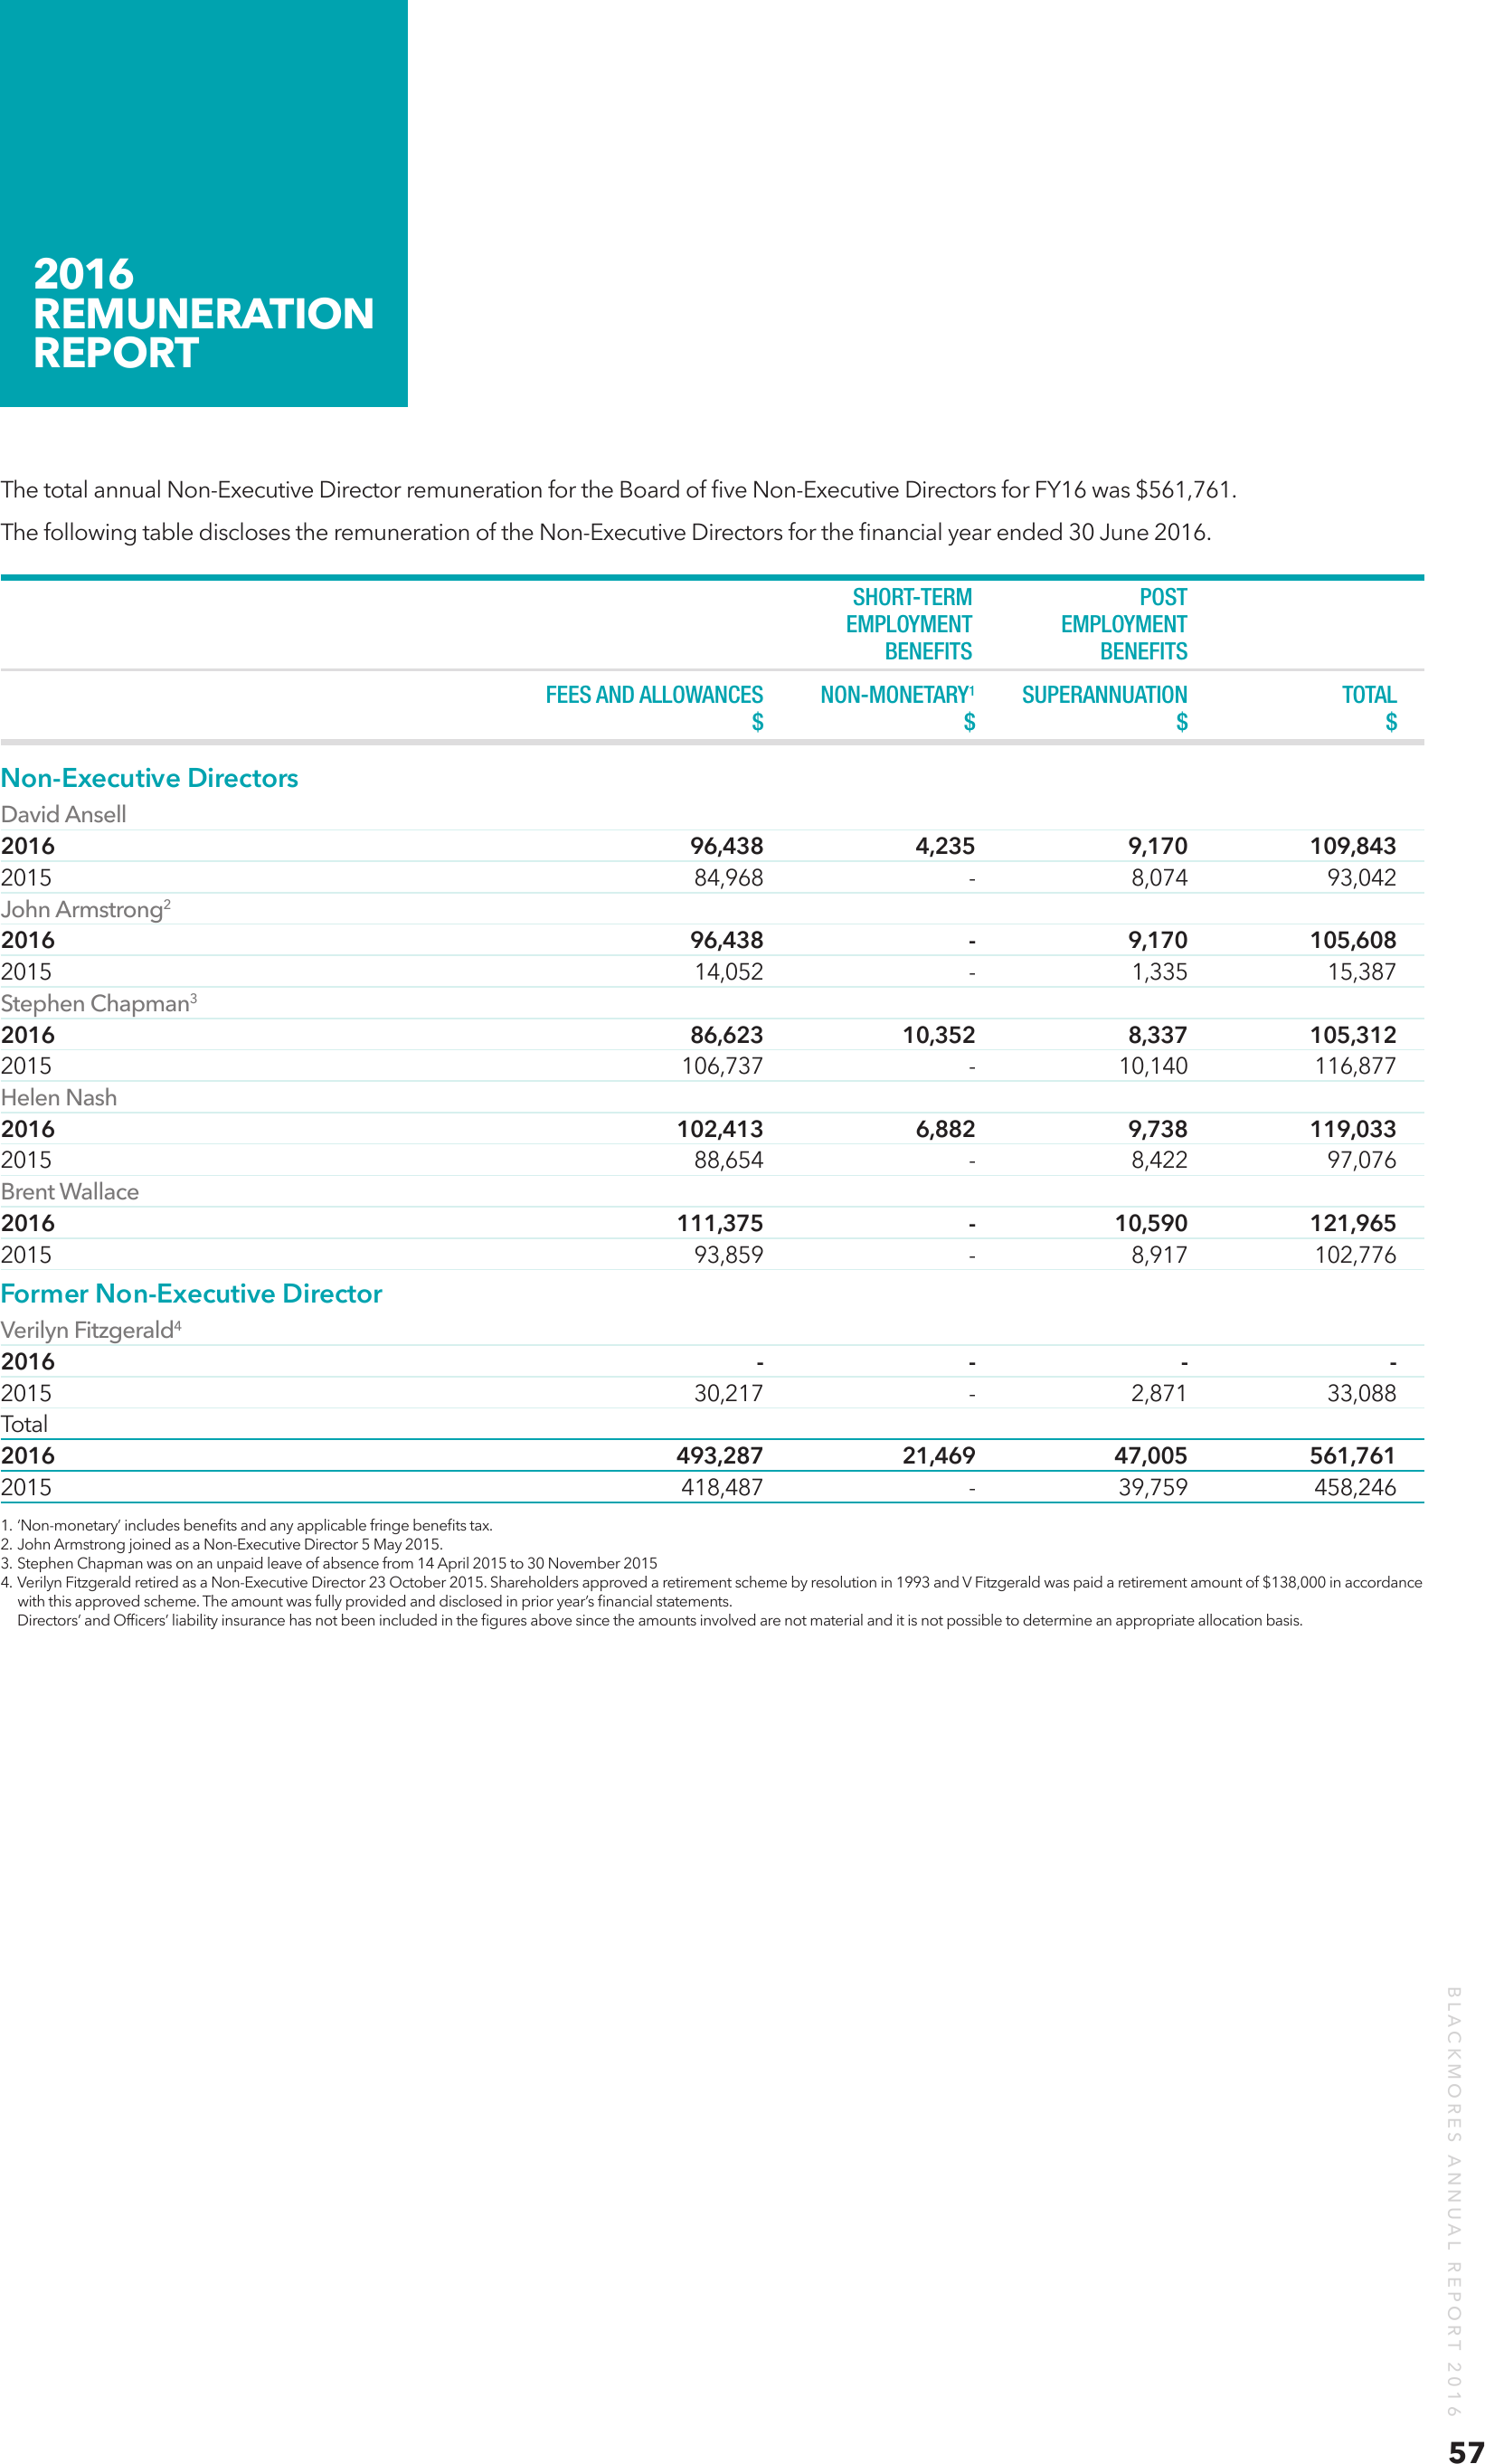
The total annual Non-Executive Director remuneration for the Board of five Non-Executive Directors for FY16 was $561,761.
The following table discloses the remuneration of the Non-Executive Directors for the financial year ended 30 June 2016.
SHORT-TERM POST
EMPLOYMENT EMPLOYMENT
BENEFITS BENEFITS
FEES AND ALLOWANCES
NON-MONETARY1 SUPERANNUATION
TOTAL
$ $ $ $
Non-Executive Directors
David Ansell
2016
2015
John Armstrong2
2016
2015
Stephen Chapman3
2016
2015
Helen Nash
2016
2015
Brent Wallace
2016
2015
Former Non-Executive Director
96,438
84,968
4,235
-
9,170 109,843
8,074
93,042
96,438
14,052
-
-
9,170 105,608
1,335
15,387
86,623 10,352 8,337 105,312
106,737
- 10,140 116,877
102,413
88,654
111,375
93,859
6,882
-
9,738 119,033
8,422
97,076
- 10,590 121,965
- 8,917 102,776
Verilyn Fitzgerald4
2016
- - - 2015
30,217
- 2,871 33,088
Total
2016
493,287 21,469 47,005 561,761
2015
418,487
- 39,759 458,246
1. ‘Non-monetary’ includes benefits and any applicable fringe benefits tax.
2. John Armstrong joined as a Non-Executive Director 5 May 2015.
3. Stephen Chapman was on an unpaid leave of absence from 14 April 2015 to 30 November 2015
4. Verilyn Fitzgerald retired as a Non-Executive Director 23 October 2015. Shareholders approved a retirement scheme by resolution in 1993 and V Fitzgerald was paid a retirement amount of $138,000 in accordance
with this approved scheme. The amount was fully provided and disclosed in prior year’s financial statements.
Directors’ and Officers’ liability insurance has not been included in the figures above since the amounts involved are not material and it is not possible to determine an appropriate allocation basis.
BLACKMORES ANNUAL REPORT 2016
57
2016
REMUNERATION
REPORT
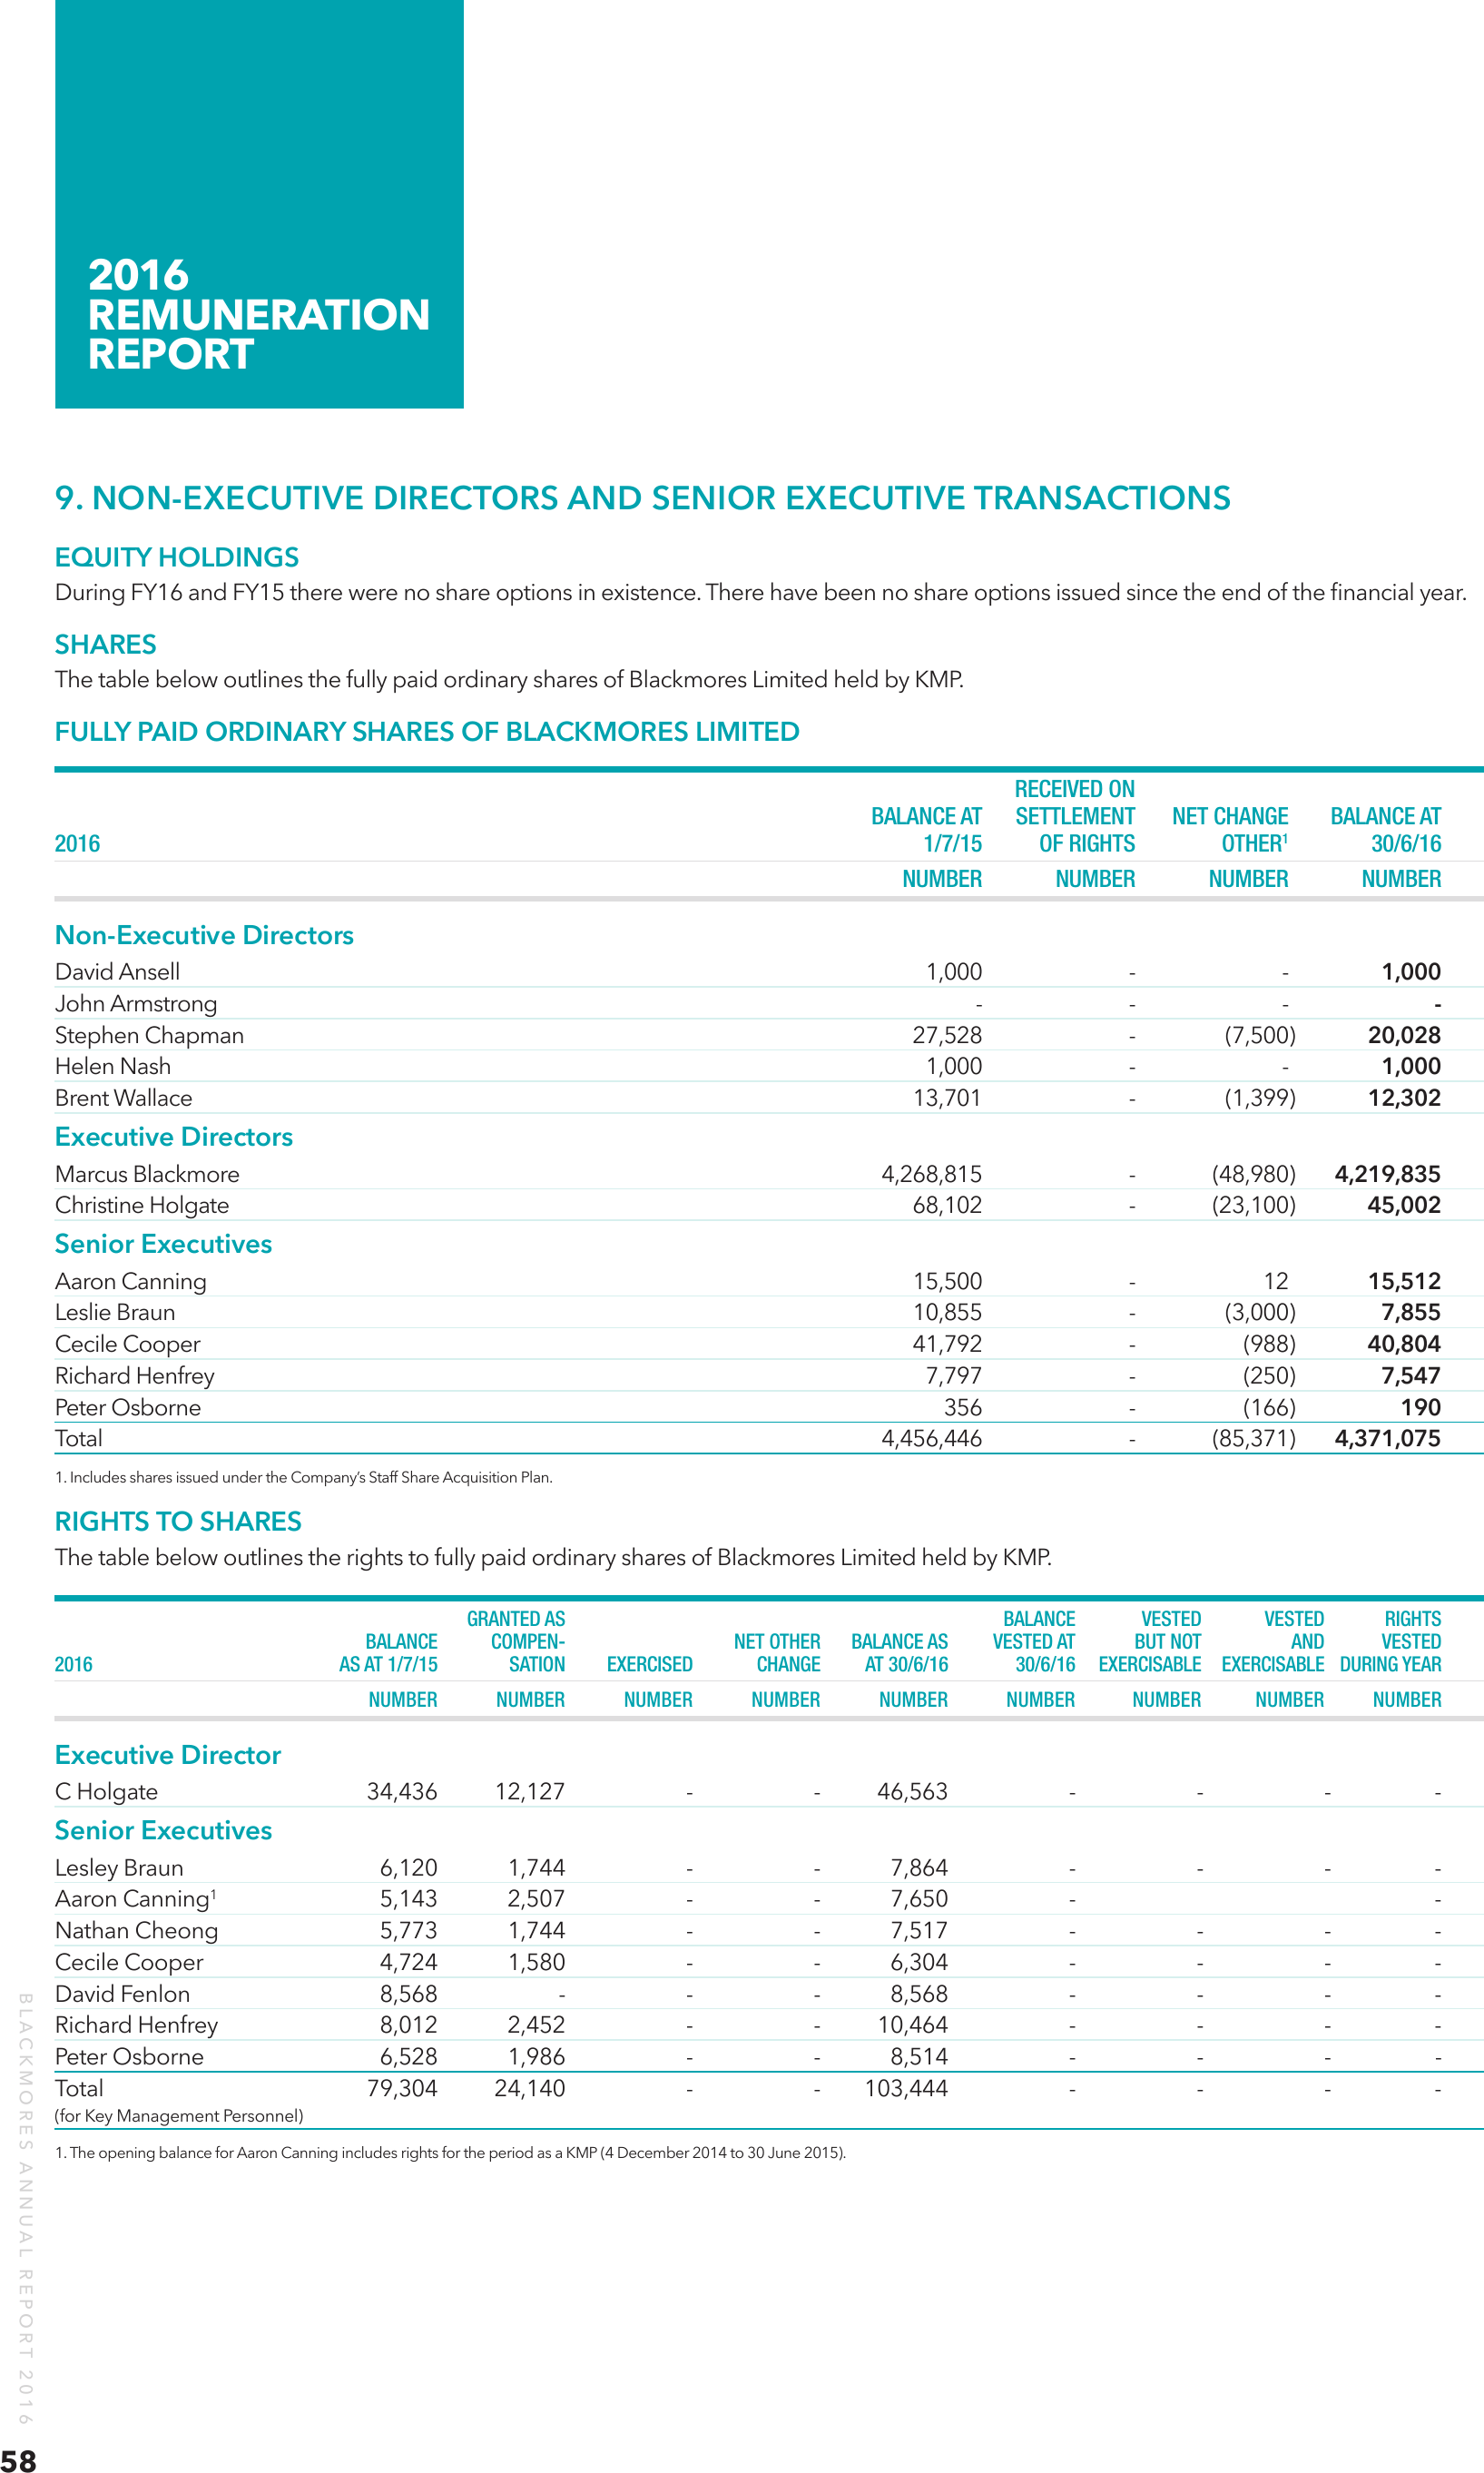
9. NON-EXECUTIVE DIRECTORS AND SENIOR EXECUTIVE TRANSACTIONS
EQUITY HOLDINGS
During FY16 and FY15 there were no share options in existence. There have been no share options issued since the end of the financial year.
SHARES
The table below outlines the fully paid ordinary shares of Blackmores Limited held by KMP.
FULLY PAID ORDINARY SHARES OF BLACKMORES LIMITED
RECEIVED ON
BALANCE AT SETTLEMENT NET CHANGE
BALANCE AT
2016
1/7/15
OF RIGHTS
OTHER1 30/6/16
NUMBER NUMBER NUMBER NUMBER
Non-Executive Directors
David Ansell
John Armstrong
Stephen Chapman
Helen Nash
Brent Wallace
1,000
-
27,528
1,000
13,701
Executive Directors
-
1,000
20,028
1,000
12,302
-
-
(7,500)
-
(1,399)
Marcus Blackmore
Christine Holgate
4,268,815
68,102
-
-
(48,980)
(23,100)
4,219,835
45,002
Aaron Canning
Leslie Braun
Cecile Cooper
Richard Henfrey
Peter Osborne
Total
15,500
10,855
41,792
7,797
356
4,456,446
-
12
(3,000)
(988)
(250)
(166)
(85,371)
15,512
7,855
40,804
7,547
190
4,371,075
Senior Executives
1. Includes shares issued under the Company’s Staff Share Acquisition Plan.
RIGHTS TO SHARES
The table below outlines the rights to fully paid ordinary shares of Blackmores Limited held by KMP.
GRANTED AS
BALANCE
VESTED
VESTED
RIGHTS
BALANCE
COMPEN-
NET OTHER BALANCE AS
VESTED AT
BUT NOT
AND
VESTED
2016
AS AT 1/7/15
SATION
EXERCISED
CHANGE
AT 30/6/16
30/6/16 EXERCISABLE EXERCISABLE DURING YEAR
NUMBER NUMBER NUMBER NUMBER NUMBER NUMBER NUMBER
NUMBER
NUMBER
Executive Director
C Holgate
34,436
12,127
-
-
Lesley Braun
Aaron Canning1
Nathan Cheong
Cecile Cooper
David Fenlon
Richard Henfrey
Peter Osborne
Total
6,120
5,143
5,773
4,724
8,568
8,012
6,528
79,304
1,744
2,507
1,744
1,580
-
2,452
1,986
24,140
-
-
46,563
-
-
Senior Executives
BLACKMORES ANNUAL REPORT 2016
58
(for Key Management Personnel)
7,864
7,650
7,517
6,304
8,568
10,464
8,514
103,444
1. The opening balance for Aaron Canning includes rights for the period as a KMP (4 December 2014 to 30 June 2015).
-
-
-
-
-
-
-
-
-
-
-
-
2016
REMUNERATION
REPORT
LOAN DISCLOSURES
There were no loan balances exceeding $100,000 due from KMP during or at the end of the financial year (2015: $nil).
OTHER TRANSACTIONS WITH KEY MANAGEMENT
Transactions entered into during the year with KMP of Blackmores Limited and the Group are on the same basis as normal employee, supplier
or customer relationship on the same terms and conditions and those dealings on an arm’s length basis which include:
• the receipt of dividends on their shareholdings, whether held privately or through related entities or through the employee share plans in
the same manner as all ordinary shareholders
• terms and conditions of employment
• purchases of goods and services
• expense reimbursement.
No interest was paid to or received from KMP.
Signed in accordance with a Resolution of the Directors made pursuant to s298(2) of the Corporations Act 2001.
On behalf of the Directors
Marcus C Blackmore AM
Director
Dated in Sydney, 24 August 2016
BLACKMORES ANNUAL REPORT 2016
59