OPERATINGFINANCIAL REVIEW
OPERATING + FINANCIAL REVIEW
+ + FINANCIALREVIEW
OPERATING
$6.7
3%
$6.7
3%
$53.1
$53.1
20% $53.1 20%
20%
2012 2012
2012
55
5
$201
77%
YEAR
YEAR
YEAR
BLACKMORES ANNUAL REPORT 2016
BL C POR RES 6
B L A C K M O R E S A N N U A LAR EK M OT 2 0 1 A N N U A L R E P O R T 2 0 1 6
16
16
$69.2 $69.2
10% 10%
$81.4
$48.0 11% $81.4
11%
7%
$48.0
7% $48.0
7%
2015
$76.4
16%
$7.6
2%
$7.6
2%
$23.2 $23.2
3%
3%
2015
2015
$316.7
67%
$7.6
2%
GROUP $316.7
67%
SALES
$471.6M
2016
$15.4
3%
$55.5
12%
$55.5
12%
$76.4
16%
$69.2
10%
$15.4
3%
$201
$201 77%
$55.5
77% 12%
SALES
SALES$76.4
16%
$260.8M
$260.8M
OF REVENUE BYBY
OF REVENUE
$23.2
SEGMENT ($M)
SEGMENT ($M)
3%
$81.4
11%
$15.4
3%
GROUP
SALES
GROUP
$260.8M GROUP
DIVERSIFICATION
OF REVENUE BY
DIVERSIFICATION
SEGMENT ($M)
DIVERSIFICATION
16
$6.7
3%
$316.7
67%
GROUP
GROUP
SALES
SALES
$471.6M
$471.6M
2016
2016
$495.4
69%
AUSTRALIA
GROUP SALES
$717.2M
$495.4 CHINA
69% $495.4
OTHER ASIA
69%
BIOCEUTICALS
OTHER
GROUP SALES
GROUP SALES
$717.2M
$717.2M
AUSTRALIA
AUSTRALIA
CHINA
CHINA
OTHER ASIA
OTHER ASIA
BIOCEUTICALS
OTHER
BIOCEUTICALS
OTHER
02
GROUP AND
DIVISIONAL
RESULTS
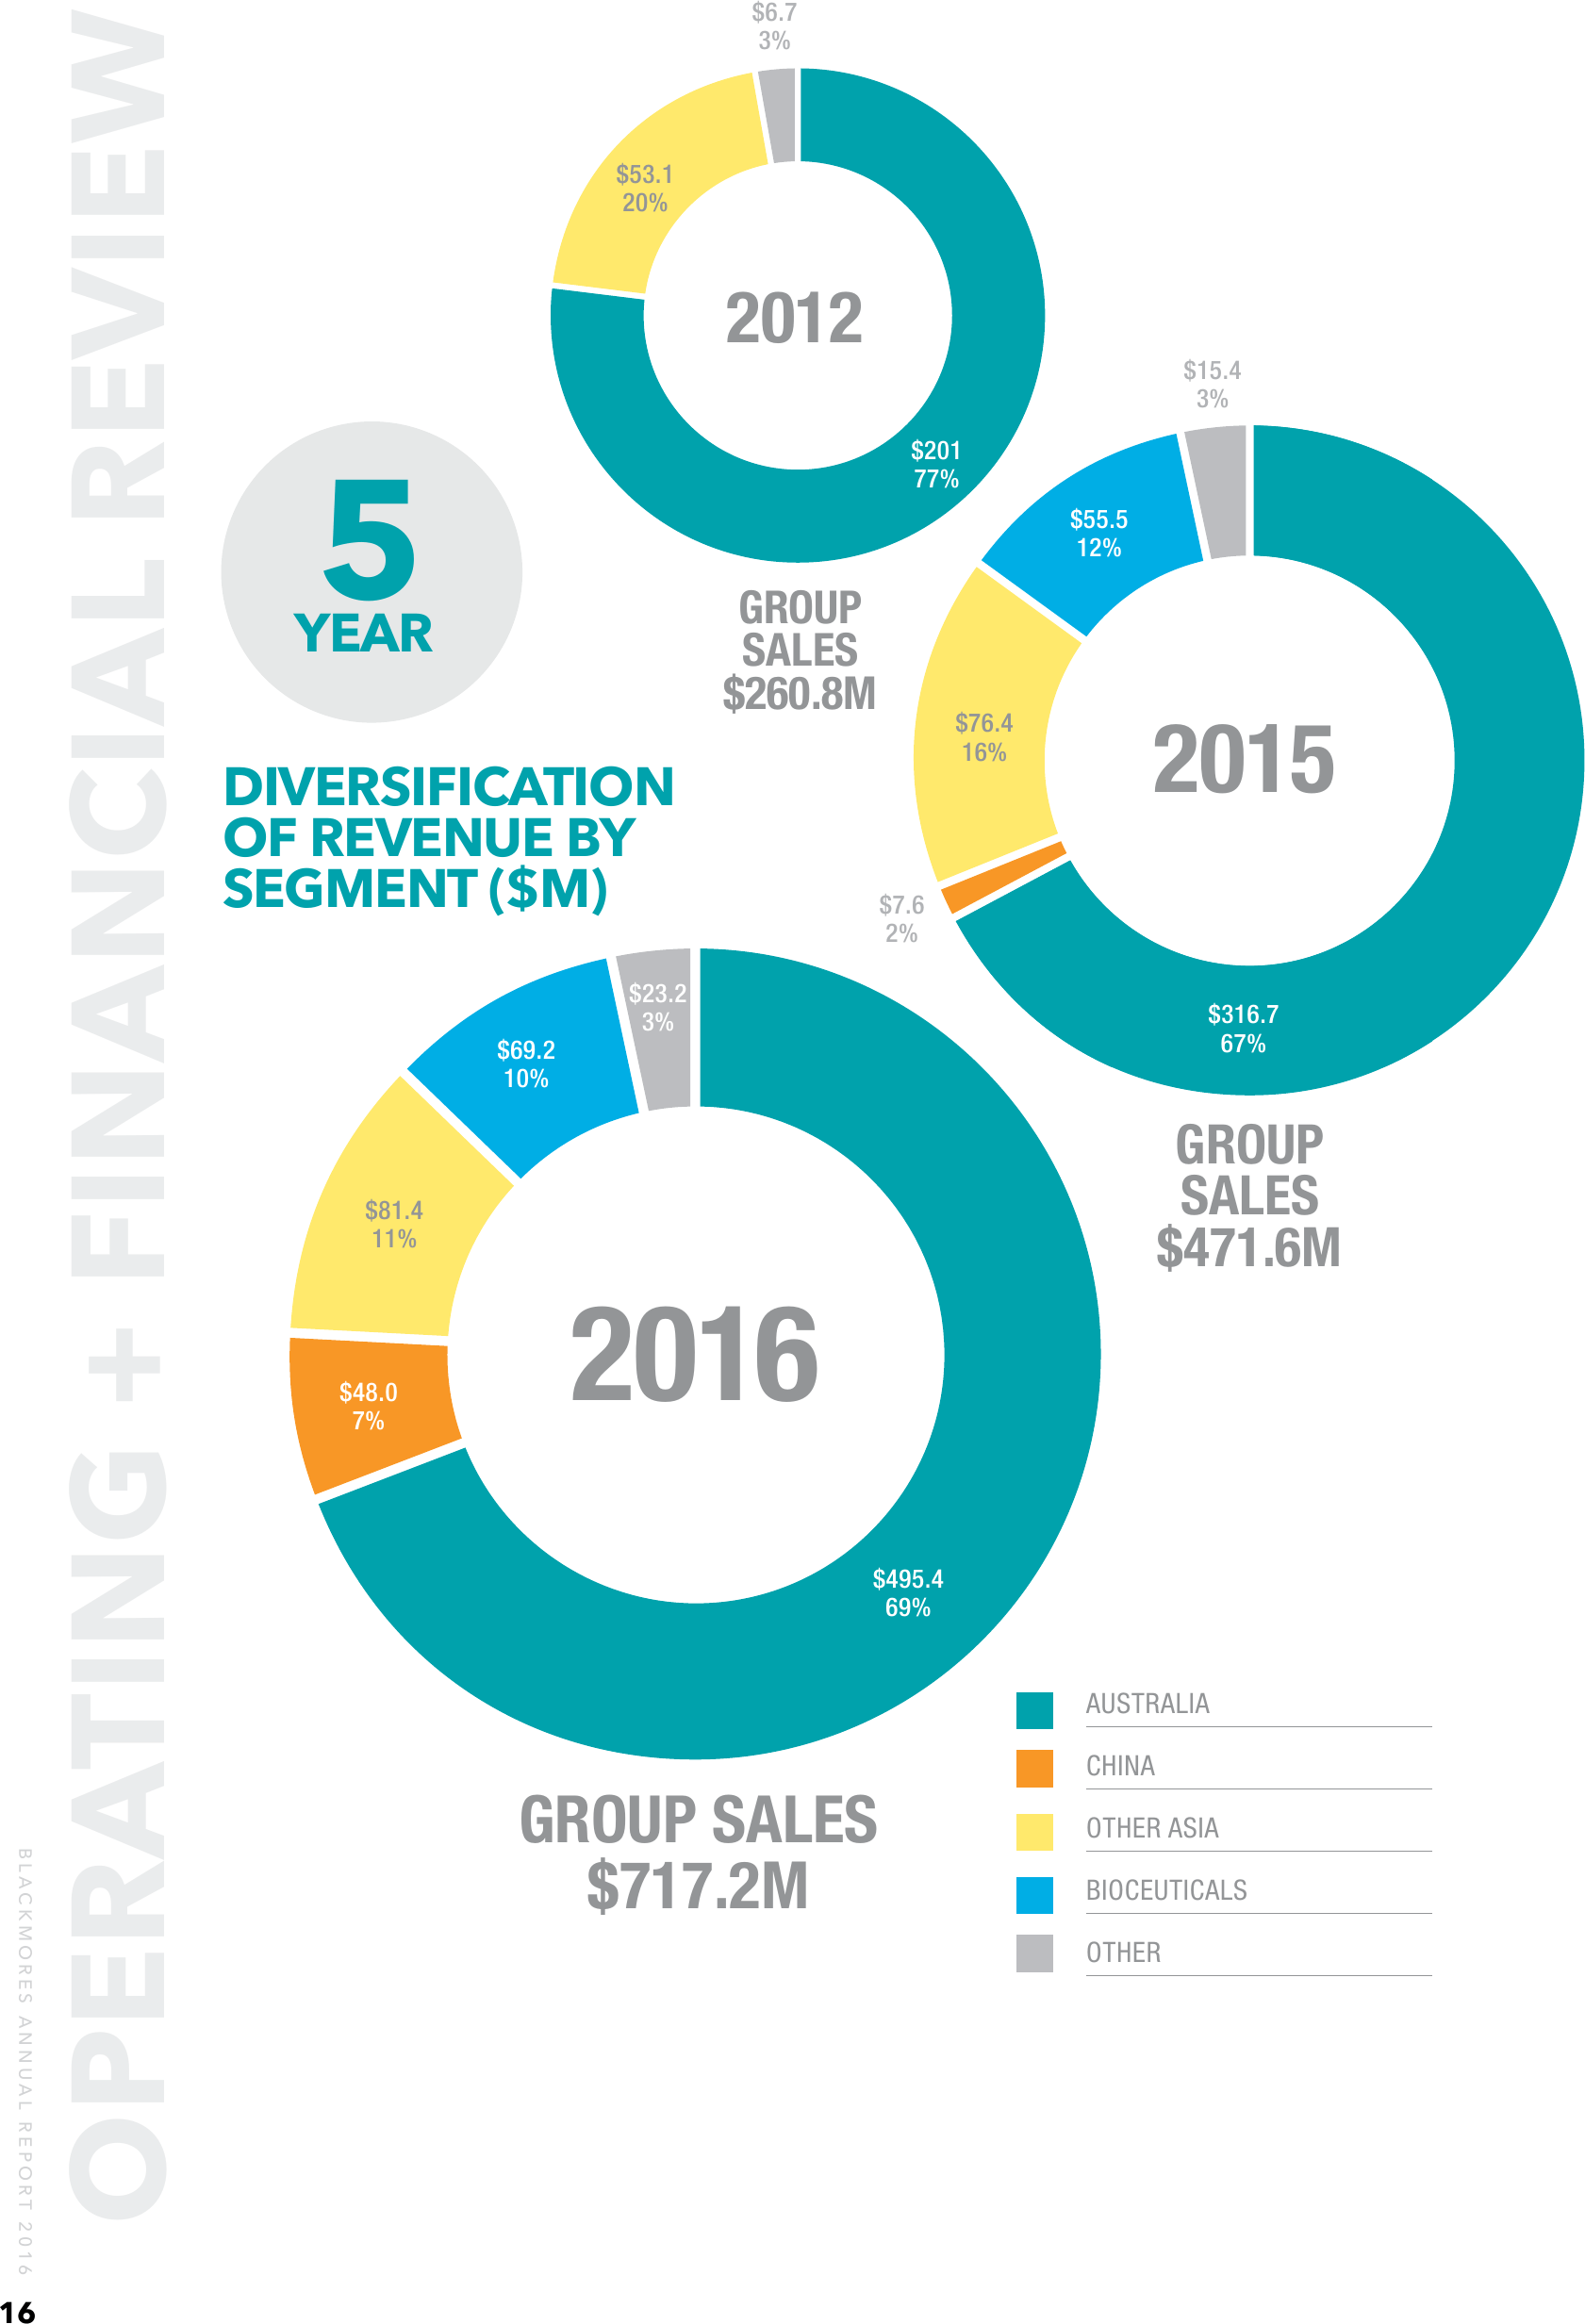
GROUP AND DIVISIONAL RESULTS
Group Sales for the year were $717.2 million
(2015: $471.6 million), an increase of 52%
compared with the prior year and our 14th
consecutive year of sales growth.
Sales in Australia, our heartland market,
were up 56% compared to the prior
year and were stimulated by a growing
consumer demand for high quality, natural
wellness products. We have launched new
products and improved our service of retail
customers while investing in our brand
through integrated marketing activity. The
Australian business continued to benefit from
increased sales through Chinese tourists and
entrepreneurs shopping in Australia and
Chinese Australian consumers purchasing for
relatives and friends and shipping to China.
Excluding the impact of these sales, the
Australian consumer business remains very
healthy with sales up approximately 10%.
By combining the contribution from these
consumers with our in-country revenues
from Asia, the Asian consumer accounts for
almost 50% of Group sales. This demonstrates
the growing demand for our brand outside
Australia and highlights the importance of
our Asia growth strategy.
Increased sales to China have been
supported by the Wholly Foreign-Owned
Enterprise (WFOE) established in recent years.
The opening of free trade zones in 2014 and
further expansion across the current year
has created a substantial opportunity for the
company, especially as Blackmores is one of
only a few companies in this category to secure
a licence to directly trade within the zones.
We are encouraged by the Australian
Government’s commitment to improved
trade relations within the Asian region, which
we believe will continue to support further
growth. Asia is a key region for Blackmores,
providing an important platform to secure
long-term profitable growth.
Blackmores Asia achieved record sales,
with full year sales up 54% to $129.4 million
and EBIT up 79% to $14.9 million. In-country
sales from Asia now comprise 18% of
Group revenue.
Blackmores Korea experienced sales
challenge. This, coupled with the investment
in Blackmores’ upcoming launch into
Indonesia, resulted in a reduction in
earnings for the ‘Other Asia’ segment
compared to the prior year.
Our growing revenue from Asia has
helped create a natural hedge whereby the
impact of changes to off-shore revenues as
a result of foreign exchange fluctuations are
partially offset by the procurement benefits
to the Group. Our growing businesses in
Asia have afforded the Group many scale
benefits which have improved our operating
efficiencies. We have grown our workforce
considerably to support the growth, creating
new jobs in Australia and Asia. Overall this
has bolstered the returns we have delivered
to our shareholders.
BioCeuticals sales grew 25%, with strong
growth in the practitioner-only range. This
performance, combined with successful new
product launches and a close management
of the cost base, delivered EBIT growth of
9% on the prior year. This EBIT result includes
the payment of incentives and profit share
to BioCeuticals employees following their
adoption of the Blackmores Enterprise
Agreement. Excluding this, underlying
BioCeuticals EBIT is up 28%. BioCeuticals
represents approximately 10% of Group
revenue.
Blackmores New Zealand, Global
Therapeutics and Blackmores’ proportion
of our Nutritional Foods partnership with
Bega are reported as part of the ‘Other’
segment. These businesses have contributed
$23 million in sales, up from $15 million the
prior year.
BLACKMORES ANNUAL REPORT 2016
17