5
5
YEAR
YEAR
HISTORY
HISTORY
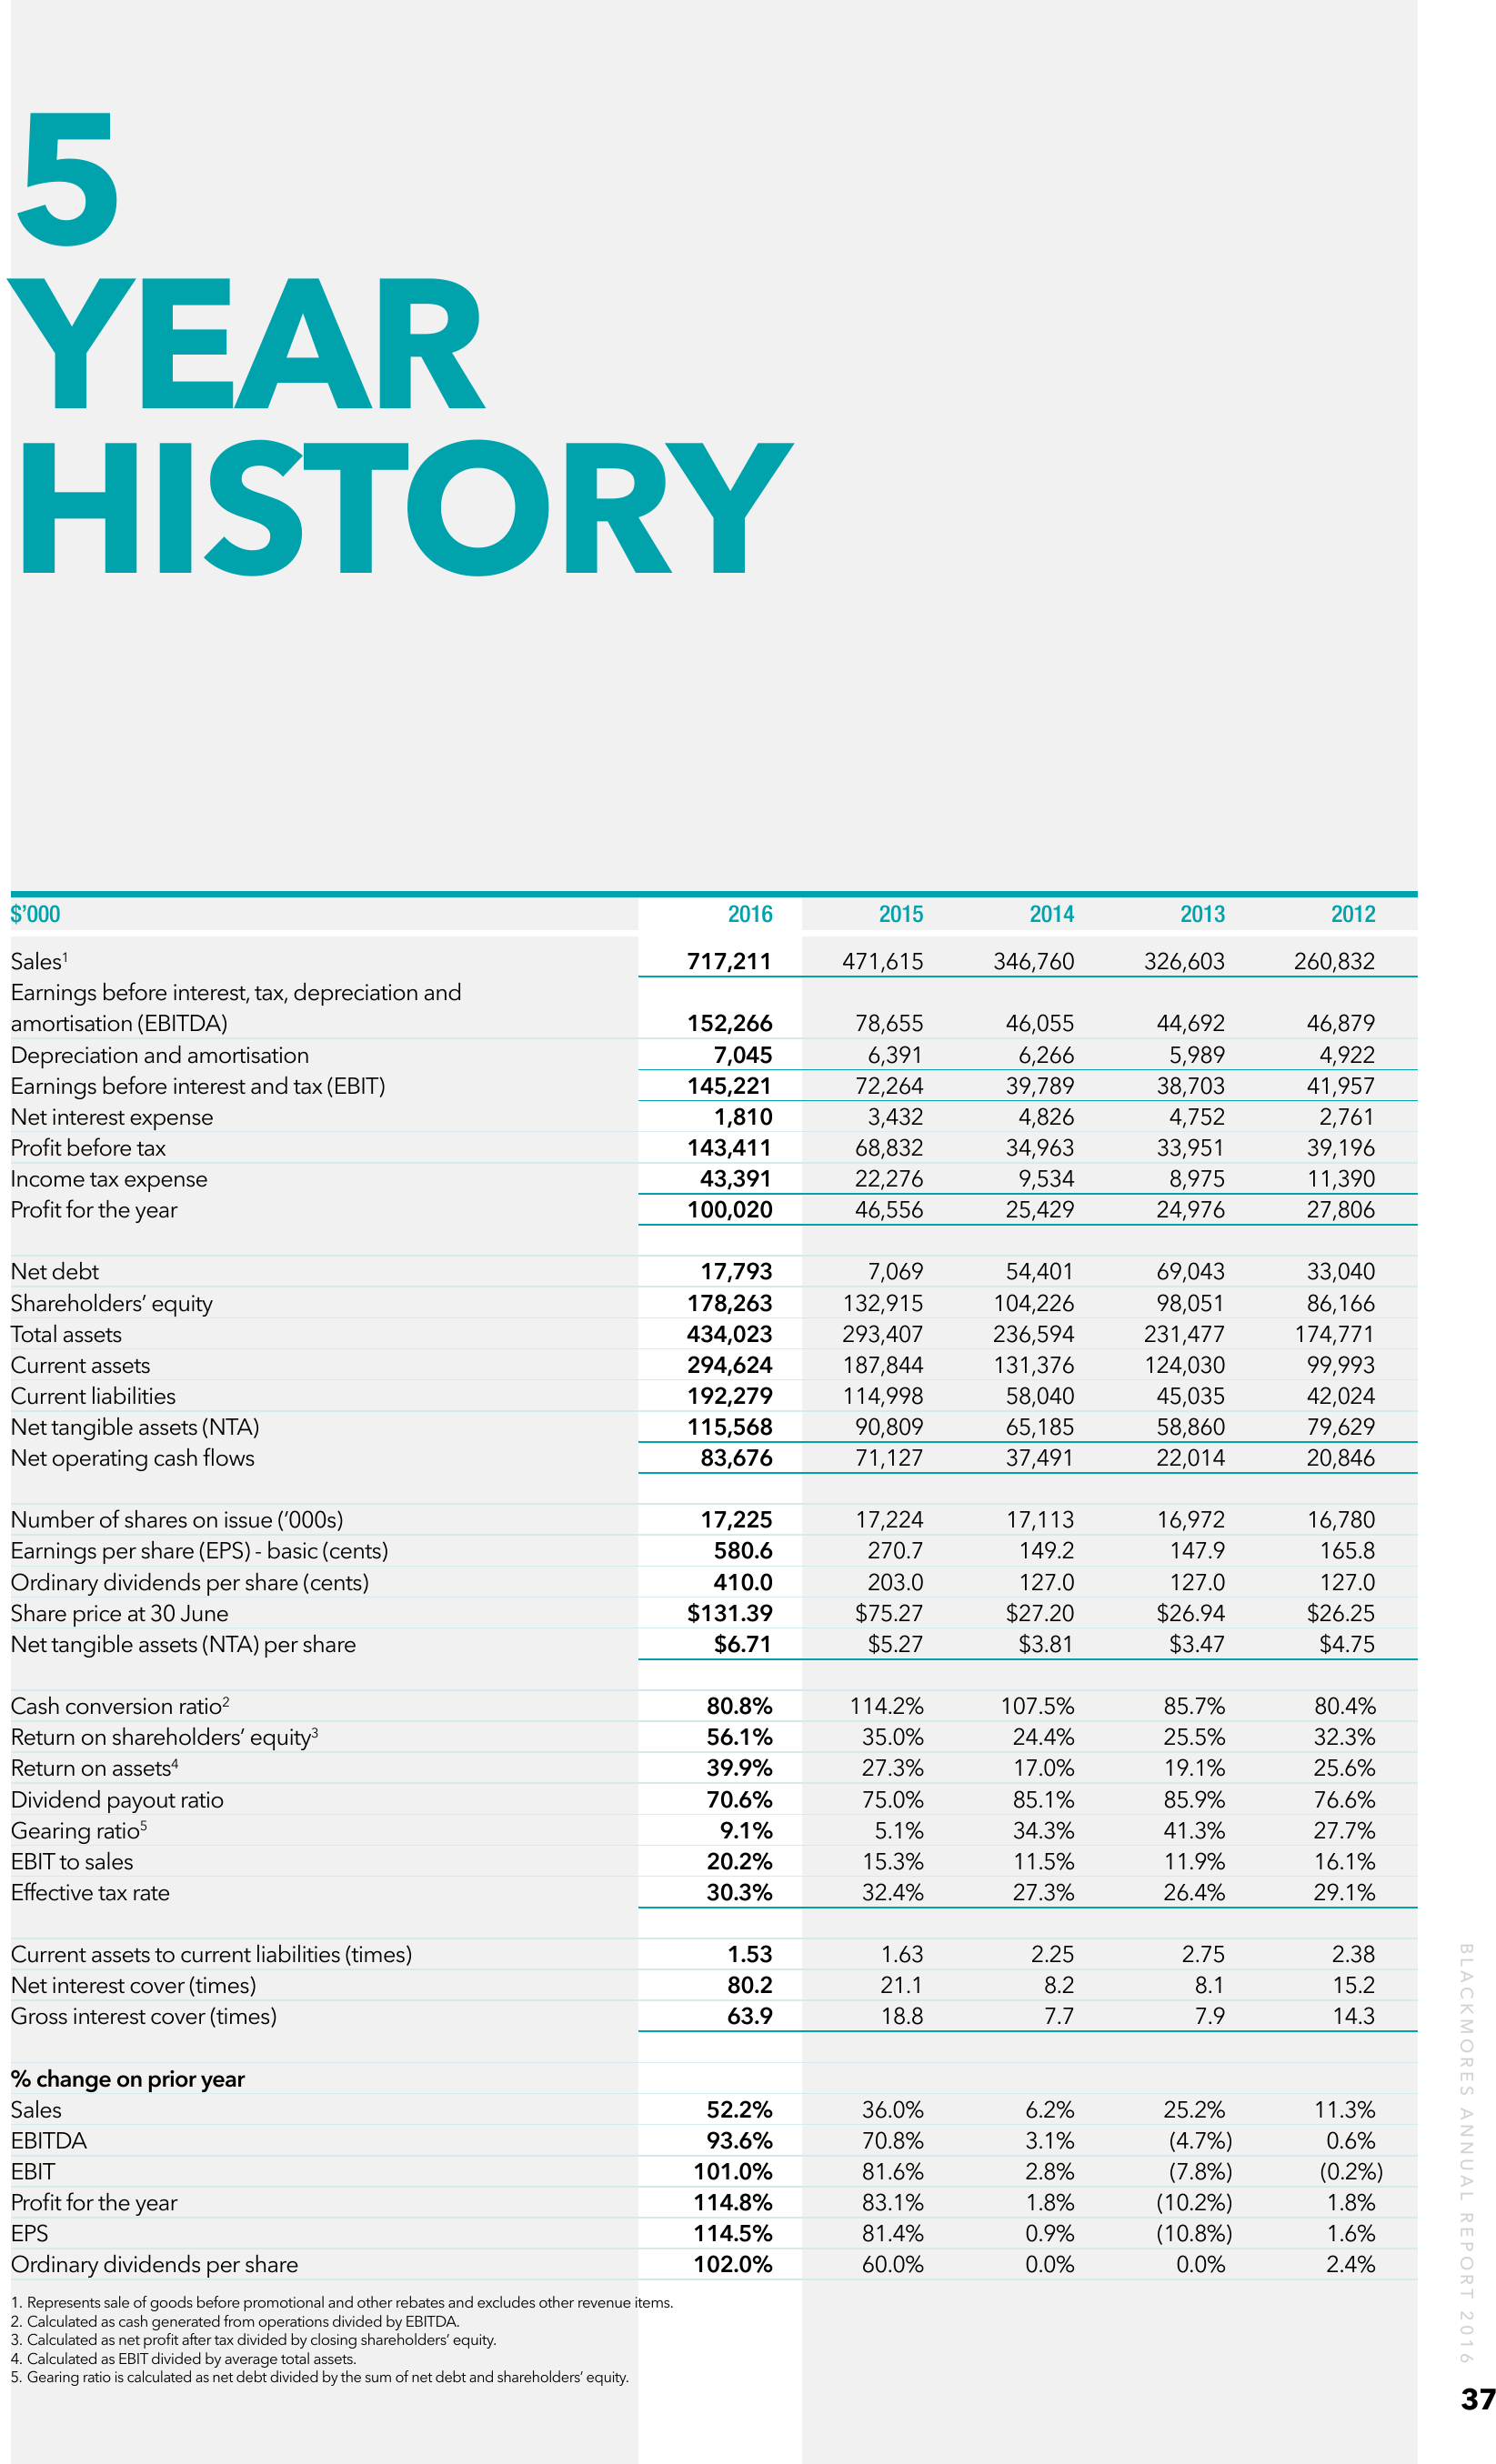
2016
2016
717,211
717,211
2015
2015
471,615
471,615
2014
2014
346,760
346,760
2013
2013
326,603
326,603
2012
2012
260,832
260,832
152,266
152,266
7,045
7,045
145,221
145,221
1,810
1,810
143,411
143,411
43,391
43,391
100,020
100,020
78,655
78,655
6,391
6,391
72,264
72,264
3,432
3,432
68,832
68,832
22,276
22,276
46,556
46,556
46,055
46,055
6,266
6,266
39,789
39,789
4,826
4,826
34,963
34,963
9,534
9,534
25,429
25,429
44,692
44,692
5,989
5,989
38,703
38,703
4,752
4,752
33,951
33,951
8,975
8,975
24,976
24,976
46,879
46,879
4,922
4,922
41,957
41,957
2,761
2,761
39,196
39,196
11,390
11,390
27,806
27,806
NetNet debt
debt
Shareholders’ equity
Shareholders’ equity
Total assets
Total assets
Current assets
Current assets
Current liabilities
Current liabilities
NetNet tangible assets (NTA)
tangible assets (NTA)
NetNet operating cash flows
operating cash flows
17,793
17,793
178,263
178,263
434,023
434,023
294,624
294,624
192,279
192,279
115,568
115,568
83,676
83,676
7,069
7,069
132,915
132,915
293,407
293,407
187,844
187,844
114,998
114,998
90,809
90,809
71,127
71,127
54,401
54,401
104,226
104,226
236,594
236,594
131,376
131,376
58,040
58,040
65,185
65,185
37,491
37,491
69,043
69,043
98,051
98,051
231,477
231,477
124,030
124,030
45,035
45,035
58,860
58,860
22,014
22,014
33,040
33,040
86,166
86,166
174,771
174,771
99,993
99,993
42,024
42,024
79,629
79,629
20,846
20,846
Number of shares on issue (’000s)
Number of shares on issue (’000s)
Earnings perper share (EPS) - basic (cents)
Earnings share (EPS) - basic (cents)
Ordinary dividends perper share (cents)
Ordinary dividends share (cents)
Share price at 30 June
Share price at 30 June
NetNet tangible assets (NTA) per share
tangible assets (NTA) per share
17,225
17,225
580.6
580.6
410.0
410.0
$131.39
$131.39
$6.71
$6.71
17,224
17,224
270.7
270.7
203.0
203.0
$75.27
$75.27
$5.27
$5.27
17,113
17,113
149.2
149.2
127.0
127.0
$27.20
$27.20
$3.81
$3.81
16,972
16,972
147.9
147.9
127.0
127.0
$26.94
$26.94
$3.47
$3.47
16,780
16,780
165.8
165.8
127.0
127.0
$26.25
$26.25
$4.75
$4.75
80.8%
80.8%
56.1%
56.1%
39.9%
39.9%
70.6%
70.6%
9.1%
9.1%
20.2%
20.2%
30.3%
30.3%
114.2%
114.2%
35.0%
35.0%
27.3%
27.3%
75.0%
75.0%
5.1%
5.1%
15.3%
15.3%
32.4%
32.4%
107.5%
107.5%
24.4%
24.4%
17.0%
17.0%
85.1%
85.1%
34.3%
34.3%
11.5%
11.5%
27.3%
27.3%
85.7%
85.7%
25.5%
25.5%
19.1%
19.1%
85.9%
85.9%
41.3%
41.3%
11.9%
11.9%
26.4%
26.4%
80.4%
80.4%
32.3%
32.3%
25.6%
25.6%
76.6%
76.6%
27.7%
27.7%
16.1%
16.1%
29.1%
29.1%
1.53
1.53
80.2
80.2
63.9
63.9
1.63
1.63
21.1
21.1
18.8
18.8
2.25
2.25
8.2
8.2
7.7
7.7
2.75
2.75
8.1
8.1
7.9
7.9
2.38
2.38
15.2
15.2
14.3
14.3
52.2%
52.2%
93.6%
93.6%
101.0%
101.0%
114.8%
114.8%
114.5%
114.5%
102.0%
102.0%
36.0%
36.0%
70.8%
70.8%
81.6%
81.6%
83.1%
83.1%
81.4%
81.4%
60.0%
60.0%
6.2%
6.2%
3.1%
3.1%
2.8%
2.8%
1.8%
1.8%
0.9%
0.9%
0.0%
0.0%
25.2%
25.2%
(4.7%)
(4.7%)
(7.8%)
(7.8%)
(10.2%)
(10.2%)
(10.8%)
(10.8%)
0.0%
0.0%
11.3%
11.3%
0.6%
0.6%
(0.2%)
(0.2%)
1.8%
1.8%
1.6%
1.6%
2.4%
2.4%
Cash conversion ratio2 2
Cash conversion ratio
Return on shareholders’ equity3 3
Return on shareholders’ equity
Return on assets4 4
Return on assets
Dividend payout ratio
Dividend payout ratio
Gearing ratio5 5
Gearing ratio
EBIT to sales
EBIT to sales
Effective tax tax rate
Effective rate
Current assets to current liabilities (times)
Current assets to current liabilities (times)
NetNet interest cover (times)
interest cover (times)
Gross interest cover (times)
Gross interest cover (times)
% change on prior year
% change on prior year
Sales
Sales
EBITDA
EBITDA
EBIT
EBIT
Profit for thethe year
Profit for year
EPS
EPS
Ordinary dividends perper share
Ordinary dividends share
1. Represents sale of goods before promotional and other rebates and excludes other revenue items.
1. Represents sale of goods before promotional and other rebates and excludes other revenue items.
2. Calculated as cash cash generated from operations divided by EBITDA.
2. Calculated as generated from operations divided by EBITDA.
3. Calculated as net profit after after tax divided by closing shareholders’ equity.
3. Calculated as net profit tax divided by closing shareholders’ equity.
4. Calculated as EBIT EBIT divided by average total assets.
4. Calculated as divided by average total assets.
5. Gearing ratio is calculated as net debt debt divided by the sum ofdebtdebt shareholders’ equity.
5. Gearing ratio is calculated as net divided by the sum of net net and and shareholders’ equity.
BLACKMORES ANNUAL REPORT 2016
BLACKMORES ANNUAL REPORT 2016
$’000
$’000
Sales1 1
Sales
Earnings before interest, tax, depreciation and
Earnings before interest, tax, depreciation and
amortisation (EBITDA)
amortisation (EBITDA)
Depreciation and amortisation
Depreciation and amortisation
Earnings before interest and tax (EBIT)
Earnings before interest and tax (EBIT)
Net interest expense
Net interest expense
Profit before tax
Profit before tax
Income tax expense
Income tax expense
Profit for the year
Profit for the year
37
37