


NOTES TO THE FINANCIAL STATEMENTS
FOR THE FINANCIAL YEAR ENDED 30 JUNE 2016
30 OPERATING LEASES
Leasing Arrangements
Operating leases relate to business premises and the Group’s motor vehicle fleet with lease terms of between three and six years. All
operating lease contracts contain market review clauses in the event that the Group exercises its option to renew. The Group does not have an
option to purchase the leased asset at the expiry of the lease period.
Non-cancellable Operating Lease Payments
2016 2015
$’000 $’000
Not later than 1 year
5,414
Later than 1 year and not later than 5 years
12,389
Later than 5 years
-
17,803
2,269
2,543
4,812
No liabilities have been recognised in respect of non-cancellable operating leases.
31 CONTINGENT LIABILITIES
The Directors do not believe there are any contingent liabilities as at 30 June 2016.
32 SUBSIDIARIES AND OTHER RELATED COMPANIES
Details of the Group’s subsidiaries at the end of the financial year are as follows.
INTEREST
2015
%
PRINCIPAL ACTIVITY
Australia
Australia
100
50
Blackmores Nominees Pty Limited4
Pat Health Limited
Blackmores Beijing Co., Limited
Blackmores (Shanghai)
Trading Co., Limited
Blackmores (Taiwan) Limited
Pure Animal Wellbeing Pty Limited4
92
OWNERSHIP
2016
%
Blackmores SPV Co Pty Limited4
Bemore Partnership Pty Limited2
BLACKMORES ANNUAL REPORT 2016
COUNTRY OF
NAME OF ENTITY
INCORPORATION
Australia
Hong Kong
China
100
100
100
-
Holding company
-
Marketing of infant and life stage
nutritional powders
100
Management of employee share plans
100
Marketing of natural health products
100
Marketing of natural health products
China
Taiwan
Australia
100
100
100
Blackmores (New Zealand) Limited
Blackmores (Singapore) Pte Limited
Blackmores (Malaysia) Sdn Bhd
Blackmores Holdings Limited
Blackmores Limited
Blackmores Korea Limited
Blackmores International Pte. Limited
PT Kalbe Blackmores Nutrition3
FIT-BioCeuticals Limited4
FIT-BioCeuticals (NZ) Limited1
PharmaFoods Pty Limited4
FIT-BioCeuticals Limited
FIT-BioCeuticals (HK) Limited
Hall Drug Technologies Pty Limited4
New Century Herbals Pty Limited4
Global Therapeutics Pty Limited1,4
New Zealand
Singapore
Malaysia
Thailand
Thailand
Korea
Singapore
Indonesia
Australia
New Zealand
Australia
United Kingdom
Hong Kong
Australia
Australia
Australia
100
100
100
100
100
100
100
50
100
100
100
100
100
100
100
100
100
Marketing of natural health products
100
Marketing of natural health products
100
Holder of intellectual property for
Animal Health Division
100
Marketing of natural health products
100
Marketing of natural health products
100
Marketing of natural health products
100
Holding company
100
Marketing of natural health products
100
Marketing of natural health products
100
Regional head office
-
Marketing of natural health products
100
Marketing of natural health products
100
Marketing of natural health products
100
Marketing of natural health products
100
Marketing of natural health products
100
Marketing of natural health products
100
Marketing of natural health products
-
Holding company
-
Marketing of natural health products
1. These wholly owned subsidiaries have entered into a deed of cross guarantee with Blackmores Limited pursuant to ASIC class order 98/1418 and are relieved from the requirement to prepare and lodge an
audited financial report.
2. Companies incorporated during the year ended 30 June 2016 for the purpose of the newly formed partnership with Bega Cheese Limited. Bemore Parternership Pty Limited represents 50% of shares issue and is a
joint operation owned and managed equally by Bega Cheese Limited and Blackmores Limited.
3. PT Kalbe Blackmores Nutrition was incorporated during the year ended 30 June 2016. Blackmores International Pte Limited’s shareholding in PT Kalbe Blackmores Nutrition represents 50%+1 of shares issued.
4. These subsidiaries are members of Blackmores Limited’s Australian Tax Consolidated Group.
Companies incorporated outside Australia carry on business in the country of incorporation. All overseas entities have been audited by
overseas firms of Deloitte Touche Tohmatsu, except the overseas entities owned by FIT-BioCeuticals Limited.
Economic Dependency
The Group is not significantly dependent upon any other entity.
NOTES TO THE FINANCIAL STATEMENTS
FOR THE FINANCIAL YEAR ENDED 30 JUNE 2016
32 SUBSIDIARIES AND OTHER RELATED COMPANIES (CONT.)
32.1
FINANCIAL SUPPORT
The Consolidated Statement of Profit or Loss and Other Comprehensive Income and the Consolidated Statement of Financial Position of the
entities party to the deed of cross guarantee are:
Statement of Profit or Loss and Other Comprehensive Income
2016
2015
$’000 $’000
Sales
620,937
409,721
Other income
11,079
18,267
Promotional and other rebates
(86,744)
(65,877)
Revenue and other income
545,272
362,111
Raw materials and consumables used
213,207
144,692
Employee benefits expense
112,303
79,918
Selling and marketing expenses
31,685
24,119
Depreciation and amortisation expenses
6,544
6,156
Operating lease rental expenses
3,262
2,721
Professional and consulting expenses
7,390
5,440
Repairs and maintenance expenses
3,886
3,176
Freight expenses
8,431
5,992
Bank charges
2,041
1,316
Other expenses
16,367
13,661
Total expenses
405,116
287,191
Earnings before interest and tax
140,156
74,920
Interest revenue
252
297
Interest expense
(2,231)
(3,914)
Net interest expense
(1,979)
(3,617)
Profit before tax
138,177
71,303
Income tax expense
(39,744)
(17,767)
Profit for the year
98,433
53,536
Other comprehensive income
Items that may be reclassified subsequently to profit or loss
Net gain/(loss) on hedging instruments entered into for cash flow hedges, net of tax
537
(572)
Other comprehensive income for the year, net of tax
537
(572)
Total comprehensive income for the year
98,970
53,136
Profit attributable to:
Owners of the parent
98,433
53,536
Non-controlling interests
-
98,433
53,536
Total comprehensive income attributable to:
Owners of the parent
98,970
53,136
Non-controlling interests
-
98,970
53,136
BLACKMORES ANNUAL REPORT 2016
93
NOTES TO THE FINANCIAL STATEMENTS
FOR THE FINANCIAL YEAR ENDED 30 JUNE 2016
32 SUBSIDIARIES AND OTHER RELATED COMPANIES (CONT.)
32.1
FINANCIAL SUPPORT (CONT.)
Statement of Financial Position
2016 2015
$’000 $’000
ASSETS
CURRENT ASSETS
Cash and cash equivalents
10,512
15,957
Receivables
129,554
101,273
Inventories
99,429
29,902
Other assets
4,493
3,582
Total current assets
243,988
150,713
NON-CURRENT ASSETS
Property, plant and equipment
66,126
60,030
Investment property
2,160
2,160
Other intangible assets
31,450
17,429
Goodwill
19,374
16,205
Deferred tax assets
8,864
6,550
Other financial assets
15,588
5,584
Total non-current assets
143,562
107,957
Total assets
387,550
258,670
LIABILITIES
CURRENT LIABILITIES
Trade and other payables
147,012
80,221
Current tax payable
21,902
11,629
Other financial liabilities
-
1,348
Provisions
8,844
5,942
Other
-
3,751
Total current liabilities
177,758
102,892
NON-CURRENT LIABILITIES
Interest-bearing liabilities
52,000
44,000
Provisions
1,134
1,274
Other financial liabilities
1,139
109
Other
1,160
226
Total non-current liabilities
55,433
45,609
Total liabilities
233,191
148,501
Net assets 154,359
110,169
EQUITY
CAPITAL AND RESERVES
BLACKMORES ANNUAL REPORT 2016
94
Issued capital
37,753
Reserves
3,419
Retained earnings
113,187
Total equity 154,359
37,753
5,813
66,603
110,169
NOTES TO THE FINANCIAL STATEMENTS
FOR THE FINANCIAL YEAR ENDED 30 JUNE 2016
33 JOINT OPERATIONS
The Group has the following interest in joint operations:
Bemore Partnership Pty Ltd
The following amounts are included in the Group’s Financial Statements in relation to the joint operation, representing the Group’s 50% share
of Bemore Partnership Pty Ltd:
2016
$’000
Sales
4,329
Promotional and other rebates
(1,075)
Revenue and other income
3,254
Raw materials and consumables
1,945
Operating expenses
2,123
Net loss for the period ended 30 June 2016
(814)
30 June 2016
$’000
Cash and cash equivalents
822
Receivables
626
Inventory
5,029
Total assets
6,477
Other payables
510
Payables to Joint operators1
1,781
Loans from Joint operators1
5,000
Total liabilities
7,291
Net liabilities
(814)
1. Included in these balances are amounts owing to the Blackmores Group of $3,960 thousand.
34 RELATED PARTY AND KEY MANAGEMENT PERSONNEL DISCLOSURES
34.1
EQUITY INTERESTS IN RELATED PARTIES
Equity interests in subsidiaries
Details of the percentage of ordinary shares held in controlled entities are disclosed in note 32 to the Consolidated Financial Statements.
34.2 DISCLOSURES
LOAN
There were no loan balances exceeding $100,000 due from Key Management Personnel during or at the end of the financial year (2015: nil).
34.3
OTHER TRANSACTIONS WITH KEY MANAGEMENT PERSONNEL
Key Management Personnel received dividends on their shareholdings, whether held privately or through related entities or through the
employee share plans on fully vested shares in the same manner as all ordinary shareholders.
No interest was paid to or received from Key Management Personnel.
34.4
RELATED PARTY TRANSACTIONS
The immediate parent and ultimate controlling party of the Group is Blackmores Limited (incorporated in Australia).
Balances and transactions between the Company and its subsidiaries, which are related parties of the Company, have been eliminated on
consolidation and are not disclosed in this note. Details of transactions between the Group and other related parties are disclosed below.
During the year, group entities did not enter into any trading transactions with related parties that are not members of the Group (2015: $nil).
Other related party transactions
During the financial year ended 30 June 2016, the following transactions occurred between the Group and its other related parties:
• alileo Kaleidoscope Pty Ltd, a company of which Brent Wallace is a Director, performed certain consulting services for the Company for
G
which fees of $100,675 (2015: $259,246) were charged.
Balances with related parties
No balances outstanding at the end of the financial year with related parties that are not members of the Group (2015: $nil).
BLACKMORES ANNUAL REPORT 2016
Trading transactions
95
NOTES TO THE FINANCIAL STATEMENTS
FOR THE FINANCIAL YEAR ENDED 30 JUNE 2016
35 NOTES TO THE CONSOLIDATED STATEMENT OF CASH FLOWS
35.1
CASH AND CASH EQUIVALENTS
For the purposes of the Consolidated Statement of Cash Flows, cash and cash equivalents includes cash on hand and in banks and
investments in money market instruments, net of outstanding bank overdrafts. Cash and cash equivalents at the end of the financial year as
shown in the Consolidated Statement of Cash Flows is reconciled to the related items in the Consolidated Statement of Financial Position as
follows:
2016 2015
$’000 $’000
Cash and bank balances
Cash and cash equivalents
35.2
37,653
37,653
36,931
36,931
570
4,430
5,000
5,000
5,000
-
-
-
44,000
69,000
113,000
FINANCING FACILITIES
Unsecured bank overdraft facility, reviewed annually and payable at call:
Amount used
Amount unused
Unsecured bank bill acceptance facility, reviewed annually:
Amount used
Amount unused
Unsecured revolving term debt facility under Common Terms Deed:
Amount used
Amount unused
55,446 82,060 137,506 -
The Group restructured borrowings during the year to unsecured debt under a Common Terms Deed with three banks.
The Group has access to financing facilities at reporting date as indicated above. The Group expects to meet its other obligations from
operating cash flows and proceeds of maturing financial assets.
35.3
RECONCILIATION OF PROFIT FOR THE YEAR TO NET CASH FLOWS FROM OPERATING ACTIVITIES
2016 2015
$’000 $’000
BLACKMORES ANNUAL REPORT 2016
96
Profit for the year
100,020
46,556
Loss on disposal of non-current assets
358
14
Interest revenue disclosed as investing cash flow
(462)
(415)
Dividend income disclosed as investing cash flow
(25)
(11)
Depreciation and amortisation of non-current assets
7,045
6,391
Revaluation of investments
(67)
(26)
Share-based payments
3,362
1,078
Other
1,308
(295)
Increase in current tax liability
11,330
9,057
Increase in deferred tax balances
(4,830)
(2,668)
Decrease in deferred tax balances related to hedge reserve in equity
(230)
172
Movements in working capital:
Current receivables
(24,212)
(34,055)
Current inventories
(73,845)
6,459
Other debtors and prepayments
(415)
(1,714)
Current trade payables
62,927
39,943
Provisions
1,412
641
Net cash flows from operating activities
83,676
71,127
35.4
NON-CASH TRANSACTIONS
During the current year, the Group entered into the following non-cash investing and financing activity which is not reflected in the
Consolidated Statement of Cash Flows:
During the year no shares (2015: 109,252) were issued under the Dividend Reinvestment Plan. Dividends settled in shares rather than cash
during the year totalled nil (2015: $3,251 thousand).
NOTES TO THE FINANCIAL STATEMENTS
FOR THE FINANCIAL YEAR ENDED 30 JUNE 2016
36 FINANCIAL INSTRUMENTS
36.1
CAPITAL MANAGEMENT
The Group manages its capital to ensure that entities in the Group will be able to continue as a going concern while maximising the return to
stakeholders through optimisation of the debt and equity balance. The Group’s overall strategy remains unchanged from 2015.
The capital structure of the Group consists of net debt (borrowings as disclosed in note 21 offset by cash and cash equivalents as disclosed in
note 35) and equity of the Group (comprising issued capital, reserves and retained earnings as disclosed in notes 23, 24 and 25 respectively).
The Group operates globally, primarily through the Company and subsidiary companies established in the markets in which the Group trades.
None of the entities within the Group are subject to externally imposed capital requirements.
Operating cash flows are used to maintain and expand the Group’s production and distribution assets, as well as make the routine outflows
of tax, dividends and repayment of maturing debt. The Group’s policy is to borrow centrally, using a variety of capital market issues and
borrowing facilities, to meet anticipated funding requirements. The Group established a debt facility in Singapore during 2016 to assist with
Asian funding.
The Group’s Audit and Risk Committee reviews the capital structure of the Group on a semi-annual basis. Based upon recommendations of
the Committee, the Group will balance its overall capital structure through the payment of dividends, new share issues and share buy-backs as
well as the issue of new debt or redemption of existing debt with third parties and, if appropriate, related parties.
Gearing ratio
The gearing ratio at the end of the year was as follows:
2016 2015
$’000 $’000
Debt1
Cash and bank balances
Net debt
Equity2
Net debt divided by the sum of net debt and shareholders’ equity
55,446
44,000
(37,653)
(36,931)
17,793
7,069
178,263
132,915
9.1% 5.1%
1. Debt is defined as long and short-term borrowings, as detailed in note 21.
2. Equity includes all capital and reserves that are managed as capital.
Categories of financial instruments
Financial Assets
Cash and bank balances
Loans and receivables
Other financial assets
37,653
134,636
471
172,760
36,931
107,076
391
144,398
Derivative instruments in designated hedge accounting relationships
Loans and payables
834
215,924
216,758
424
138,908
139,332
Financial Liabilities
36.2
FINANCIAL RISK MANAGEMENT OBJECTIVES
The Group’s Corporate Treasury function provides services to the business, coordinates access to domestic and international financial markets
and monitors and manages the financial risks relating to the operations of the Group.
The Group seeks to minimise the effects of currency risk and interest rate risk by using derivative financial instruments to hedge these risk
exposures. The use of financial derivatives is governed by the Group’s policies approved by the Board of Directors, which provide written
principles on foreign exchange risk, interest rate risk and the use of financial derivatives. Compliance with policies and exposure limits
is reviewed internally on a continuous basis. The Group does not enter into or trade financial instruments, including derivative financial
instruments, for speculative purposes.
BLACKMORES ANNUAL REPORT 2016
36.3
SIGNIFICANT ACCOUNTING POLICIES
Details of the significant accounting policies and methods adopted, including the criteria for recognition, the basis of measurement and the
basis on which revenues and expenses are recognised, in respect of each class of financial asset and financial liability, are disclosed in note 2.6
to the Consolidated Financial Statements.
97
NOTES TO THE FINANCIAL STATEMENTS
FOR THE FINANCIAL YEAR ENDED 30 JUNE 2016
36 FINANCIAL INSTRUMENTS (CONT.)
36.4
FOREIGN CURRENCY RISK MANAGEMENT
The Group undertakes transactions denominated in foreign currencies; consequently exposures to exchange rate fluctuations arise. Exchange
rate exposures are managed within approved policy parameters utilising forward exchange contracts.
The Group is mainly exposed to New Zealand Dollar (NZD), United States Dollar (USD), and Canadian Dollar (CAD).
The Australian Dollar carrying amount of the Group’s foreign currency denominated monetary assets and monetary liabilities at the end of the
reporting period are as follows:
LIABILITIES
ASSETS
2016 2015 2016 2015
$’000
$’000
$’000
$’000
United States Dollar (USD)
New Zealand Dollar (NZD)
Euro (EUR)
Canadian Dollar (CAD)
Swiss Franc (CHF)
Chinese (CNY)
Japanese Yen (JPY)
South Korean Won (KRW)
Thai Baht (THB)
Singapore Dollars (SGD)
Malaysian Ringgit (MYR)
19,363
10,917
832
690
93
4
17
47
5
2
7
4,759
7,678
79
226
(13)
-
-
-
-
-
-
3,045
297
-
-
-
57
-
-
12
-
-
1,158
19
-
Foreign currency sensitivity analysis
The following table details the Group’s sensitivity to a 10% increase and decrease in the Australian Dollar against the relevant foreign
currencies. 10% is the sensitivity rate used when reporting foreign currency risk internally to Key Management Personnel and represents
management’s assessment of the possible change in foreign exchange rates. The sensitivity analysis includes only outstanding foreign
currency denominated monetary items and adjusts their translation at the period end for a 10% change in foreign currency rates. A positive
number below indicates an increase in profit or equity where the Australian Dollar strengthens 10% against the relevant currency. For a
10% weakening of the Australian Dollar against the relevant currency, there would be a comparable impact on the profit or equity, and the
balances below would be negative.
PROFIT/ (LOSS)
10% INCREASE
10% DECREASE
2016 2015 2016 2015
$’000
$’000
$’000
$’000
USD impact
NZD impact
EUR impact
CAD impact
CHF impact
CNY impact
JPY impact
KRW impact
1,483
965
75
63
9
(5)
2
4
327
694
7
21
(1)
-
-
-
(1,813)
(1,180)
(93)
(76)
(10)
6
(2)
(5)
(400)
(851)
(9)
(25)
1
-
This is mainly attributable to the exposure outstanding on foreign currency payables in the Group at the end of the reporting period.
BLACKMORES ANNUAL REPORT 2016
98
EQUITY
10% INCREASE
10% DECREASE
2016 2015 2016 2015
$’000
$’000
$’000
$’000
USD impact
NZD impact
(2,499)
(24)
-
(2,273)
2,098
73
819
From time to time during the year, the Group entered into NZD, USD and CAD forward exchange contracts in order to reduce foreign
currency risk.
Option contracts
The Group did not utilise any option contracts during the year, so there were no open contracts at 30 June 2016 (2015: $nil).
Forward foreign exchange contracts
The Group utilised forward foreign exchange contracts during the year. At 30 June 2016 there were open contracts of NZD2.0m, USD18.5m
and MYR 1.2m (2015: NZD19.4m, USD3.1m and CAD 0.5m). These contracts are a partial hedge for upcoming raw material purchases.
NOTES TO THE FINANCIAL STATEMENTS
FOR THE FINANCIAL YEAR ENDED 30 JUNE 2016
36 FINANCIAL INSTRUMENTS (CONT.)
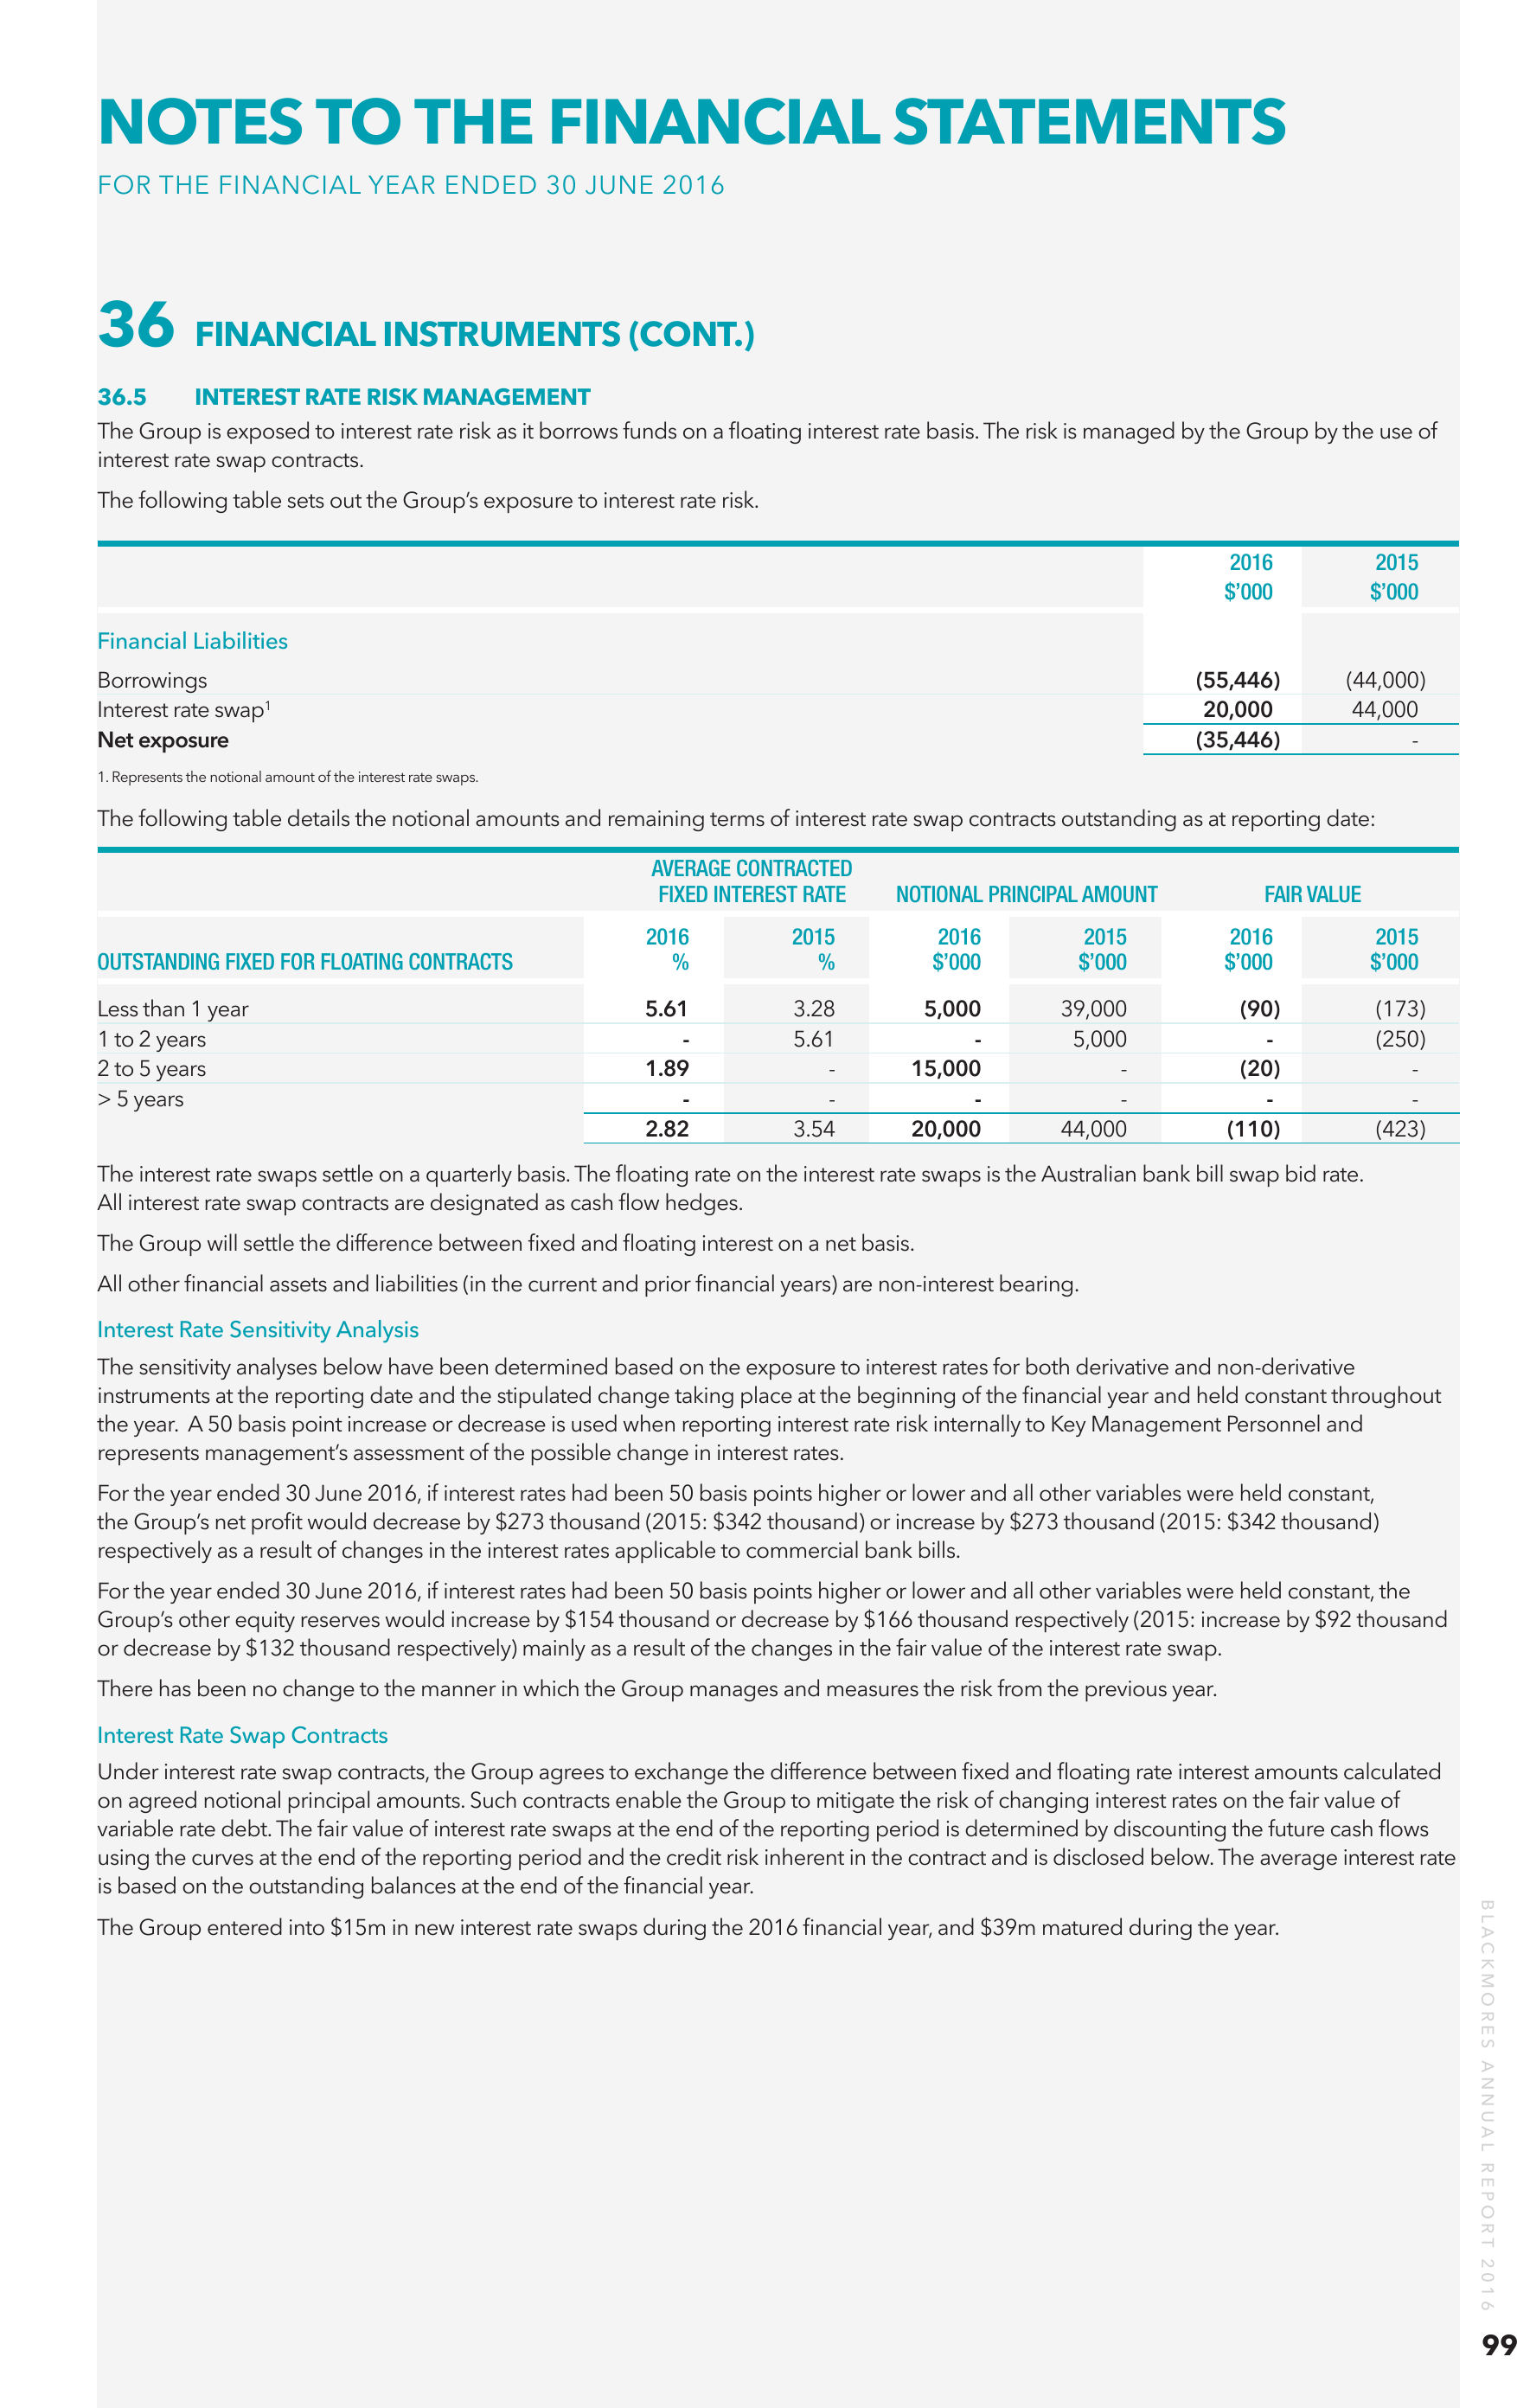
36.5
INTEREST RATE RISK MANAGEMENT
The Group is exposed to interest rate risk as it borrows funds on a floating interest rate basis. The risk is managed by the Group by the use of
interest rate swap contracts.
The following table sets out the Group’s exposure to interest rate risk.
2016 2015
$’000 $’000
Financial Liabilities
Borrowings
(55,446)
(44,000)
Interest rate swap1
20,000
44,000
Net exposure
(35,446)
1. Represents the notional amount of the interest rate swaps.
The following table details the notional amounts and remaining terms of interest rate swap contracts outstanding as at reporting date:
AVERAGE CONTRACTED
FIXED INTEREST RATE
OUTSTANDING FIXED FOR FLOATING CONTRACTS
2016 2015 2016 2015 2016 2015
%
%
$’000
$’000
$’000
$’000
Less than 1 year
1 to 2 years
2 to 5 years
> 5 years
5.61
-
1.89
-
2.82
3.28
5.61
-
-
3.54
NOTIONAL PRINCIPAL AMOUNT
5,000
-
15,000
-
20,000
39,000
5,000
-
-
44,000
FAIR VALUE
(90)
-
(20)
-
(110)
(173)
(250)
(423)
The interest rate swaps settle on a quarterly basis. The floating rate on the interest rate swaps is the Australian bank bill swap bid rate.
All interest rate swap contracts are designated as cash flow hedges.
The Group will settle the difference between fixed and floating interest on a net basis.
All other financial assets and liabilities (in the current and prior financial years) are non-interest bearing.
Interest Rate Sensitivity Analysis
The sensitivity analyses below have been determined based on the exposure to interest rates for both derivative and non-derivative
instruments at the reporting date and the stipulated change taking place at the beginning of the financial year and held constant throughout
the year. A 50 basis point increase or decrease is used when reporting interest rate risk internally to Key Management Personnel and
represents management’s assessment of the possible change in interest rates.
For the year ended 30 June 2016, if interest rates had been 50 basis points higher or lower and all other variables were held constant,
the Group’s net profit would decrease by $273 thousand (2015: $342 thousand) or increase by $273 thousand (2015: $342 thousand)
respectively as a result of changes in the interest rates applicable to commercial bank bills.
For the year ended 30 June 2016, if interest rates had been 50 basis points higher or lower and all other variables were held constant, the
Group’s other equity reserves would increase by $154 thousand or decrease by $166 thousand respectively (2015: increase by $92 thousand
or decrease by $132 thousand respectively) mainly as a result of the changes in the fair value of the interest rate swap.
There has been no change to the manner in which the Group manages and measures the risk from the previous year.
Interest Rate Swap Contracts
The Group entered into $15m in new interest rate swaps during the 2016 financial year, and $39m matured during the year.
BLACKMORES ANNUAL REPORT 2016
Under interest rate swap contracts, the Group agrees to exchange the difference between fixed and floating rate interest amounts calculated
on agreed notional principal amounts. Such contracts enable the Group to mitigate the risk of changing interest rates on the fair value of
variable rate debt. The fair value of interest rate swaps at the end of the reporting period is determined by discounting the future cash flows
using the curves at the end of the reporting period and the credit risk inherent in the contract and is disclosed below. The average interest rate
is based on the outstanding balances at the end of the financial year.
99
NOTES TO THE FINANCIAL STATEMENTS
FOR THE FINANCIAL YEAR ENDED 30 JUNE 2016
36 FINANCIAL INSTRUMENTS (CONT.)
36.6 RISK MANAGEMENT
CREDIT
Credit risk refers to the risk that a counterparty will default on its contractual obligations resulting in financial loss to the Group. The Group has
adopted a policy of only dealing with creditworthy counterparties. The Group only transacts with entities that have a positive credit history.
The information used to determine creditworthiness is supplied by independent rating agencies where available and, if not available, the
Group uses publicly available financial information, trade references and their own trading record to rate their major customers.
Ongoing credit evaluation is performed on the financial condition of accounts receivable and, where appropriate, credit guarantee insurance.
The credit risk on liquid funds and derivative financial instruments is limited because the counterparties are banks with sound credit ratings
assigned by international credit-rating agencies.
The carrying amount of financial assets recorded in the consolidated Financial Statements, net of any allowances for losses, represents the
Group’s maximum exposure to credit risk.
There has been no change to the Group’s exposure to credit risk or the manner in which it manages and measures the risk from the previous
year.
36.7
LIQUIDITY RISK MANAGEMENT
Ultimate responsibility for liquidity risk management rests with the Board of Directors, which has established an appropriate liquidity
risk management framework for the management of the Group’s short-, medium- and long-term funding and liquidity management
requirements. The Group manages liquidity risk by maintaining adequate reserves and banking facilities and through the continual
monitoring of forecast and actual cash flows.
Liquidity and Interest Risk
The following tables detail the Group’s remaining contractual maturity for its non-derivative financial liabilities with agreed repayment periods.
The tables have been drawn up based on the undiscounted cash flows of financial liabilities based on the earliest date on which the Group
can be required to pay. The tables include both interest and principal cash flows.
WEIGHTED AVERAGE
3 MONTHS
EFFECTIVE INTEREST
<1 MONTH 1-3 MONTHS
TO 1 YEAR
1-5 YEARS
5 YEARS
TOTAL
RATE % $’000 $’000 $’000 $’000 $’000 $’000
2016
Trade and other payables
0.00 -
Borrowings
2.82 -
-
160,478
-
160,478
-
-
-
-
55,446
55,446
-
-
-
160,478
55,446
215,924
94,908
-
94,908
-
-
-
-
44,000
44,000
-
-
-
94,908
44,000
138,908
2015
Trade and other payables
0.00
Borrowings
3.54
-
-
-
There has been no change to the Group’s exposure to liquidity risks or the manner in which it manages and measures the risk from the
previous year.
The following table details the Group’s liquidity analysis for its derivative financial instruments. The table has been drawn up based on the
undiscounted net cash inflows/(outflows) on the derivative instrument that settle on a net basis and the undiscounted gross inflows/(outflows)
on those derivatives that require gross settlement. When the amount payable or receivable is not fixed, the amount disclosed has been
determined by reference to the projected interest rates as illustrated by the yield curves existing at the reporting date.
3 MONTHS
<1 MONTH 1-3 MONTHS
TO 1 YEAR
1-5 YEARS
5 YEARS
TOTAL
$’000 $’000 $’000 $’000 $’000 $’000
2016
BLACKMORES ANNUAL REPORT 2016
100
Net settled:
Interest rate swaps
(84) - (74) 40 -
(118)
(84)
-
(74)
40
-
(118)
2015
Net settled:
Interest rate swaps
(89)
-
(257)
(84)
-
(430)
(89)
-
(257)
(84)
-
(430)
NOTES TO THE FINANCIAL STATEMENTS
FOR THE FINANCIAL YEAR ENDED 30 JUNE 2016
36 FINANCIAL INSTRUMENTS (CONT.)
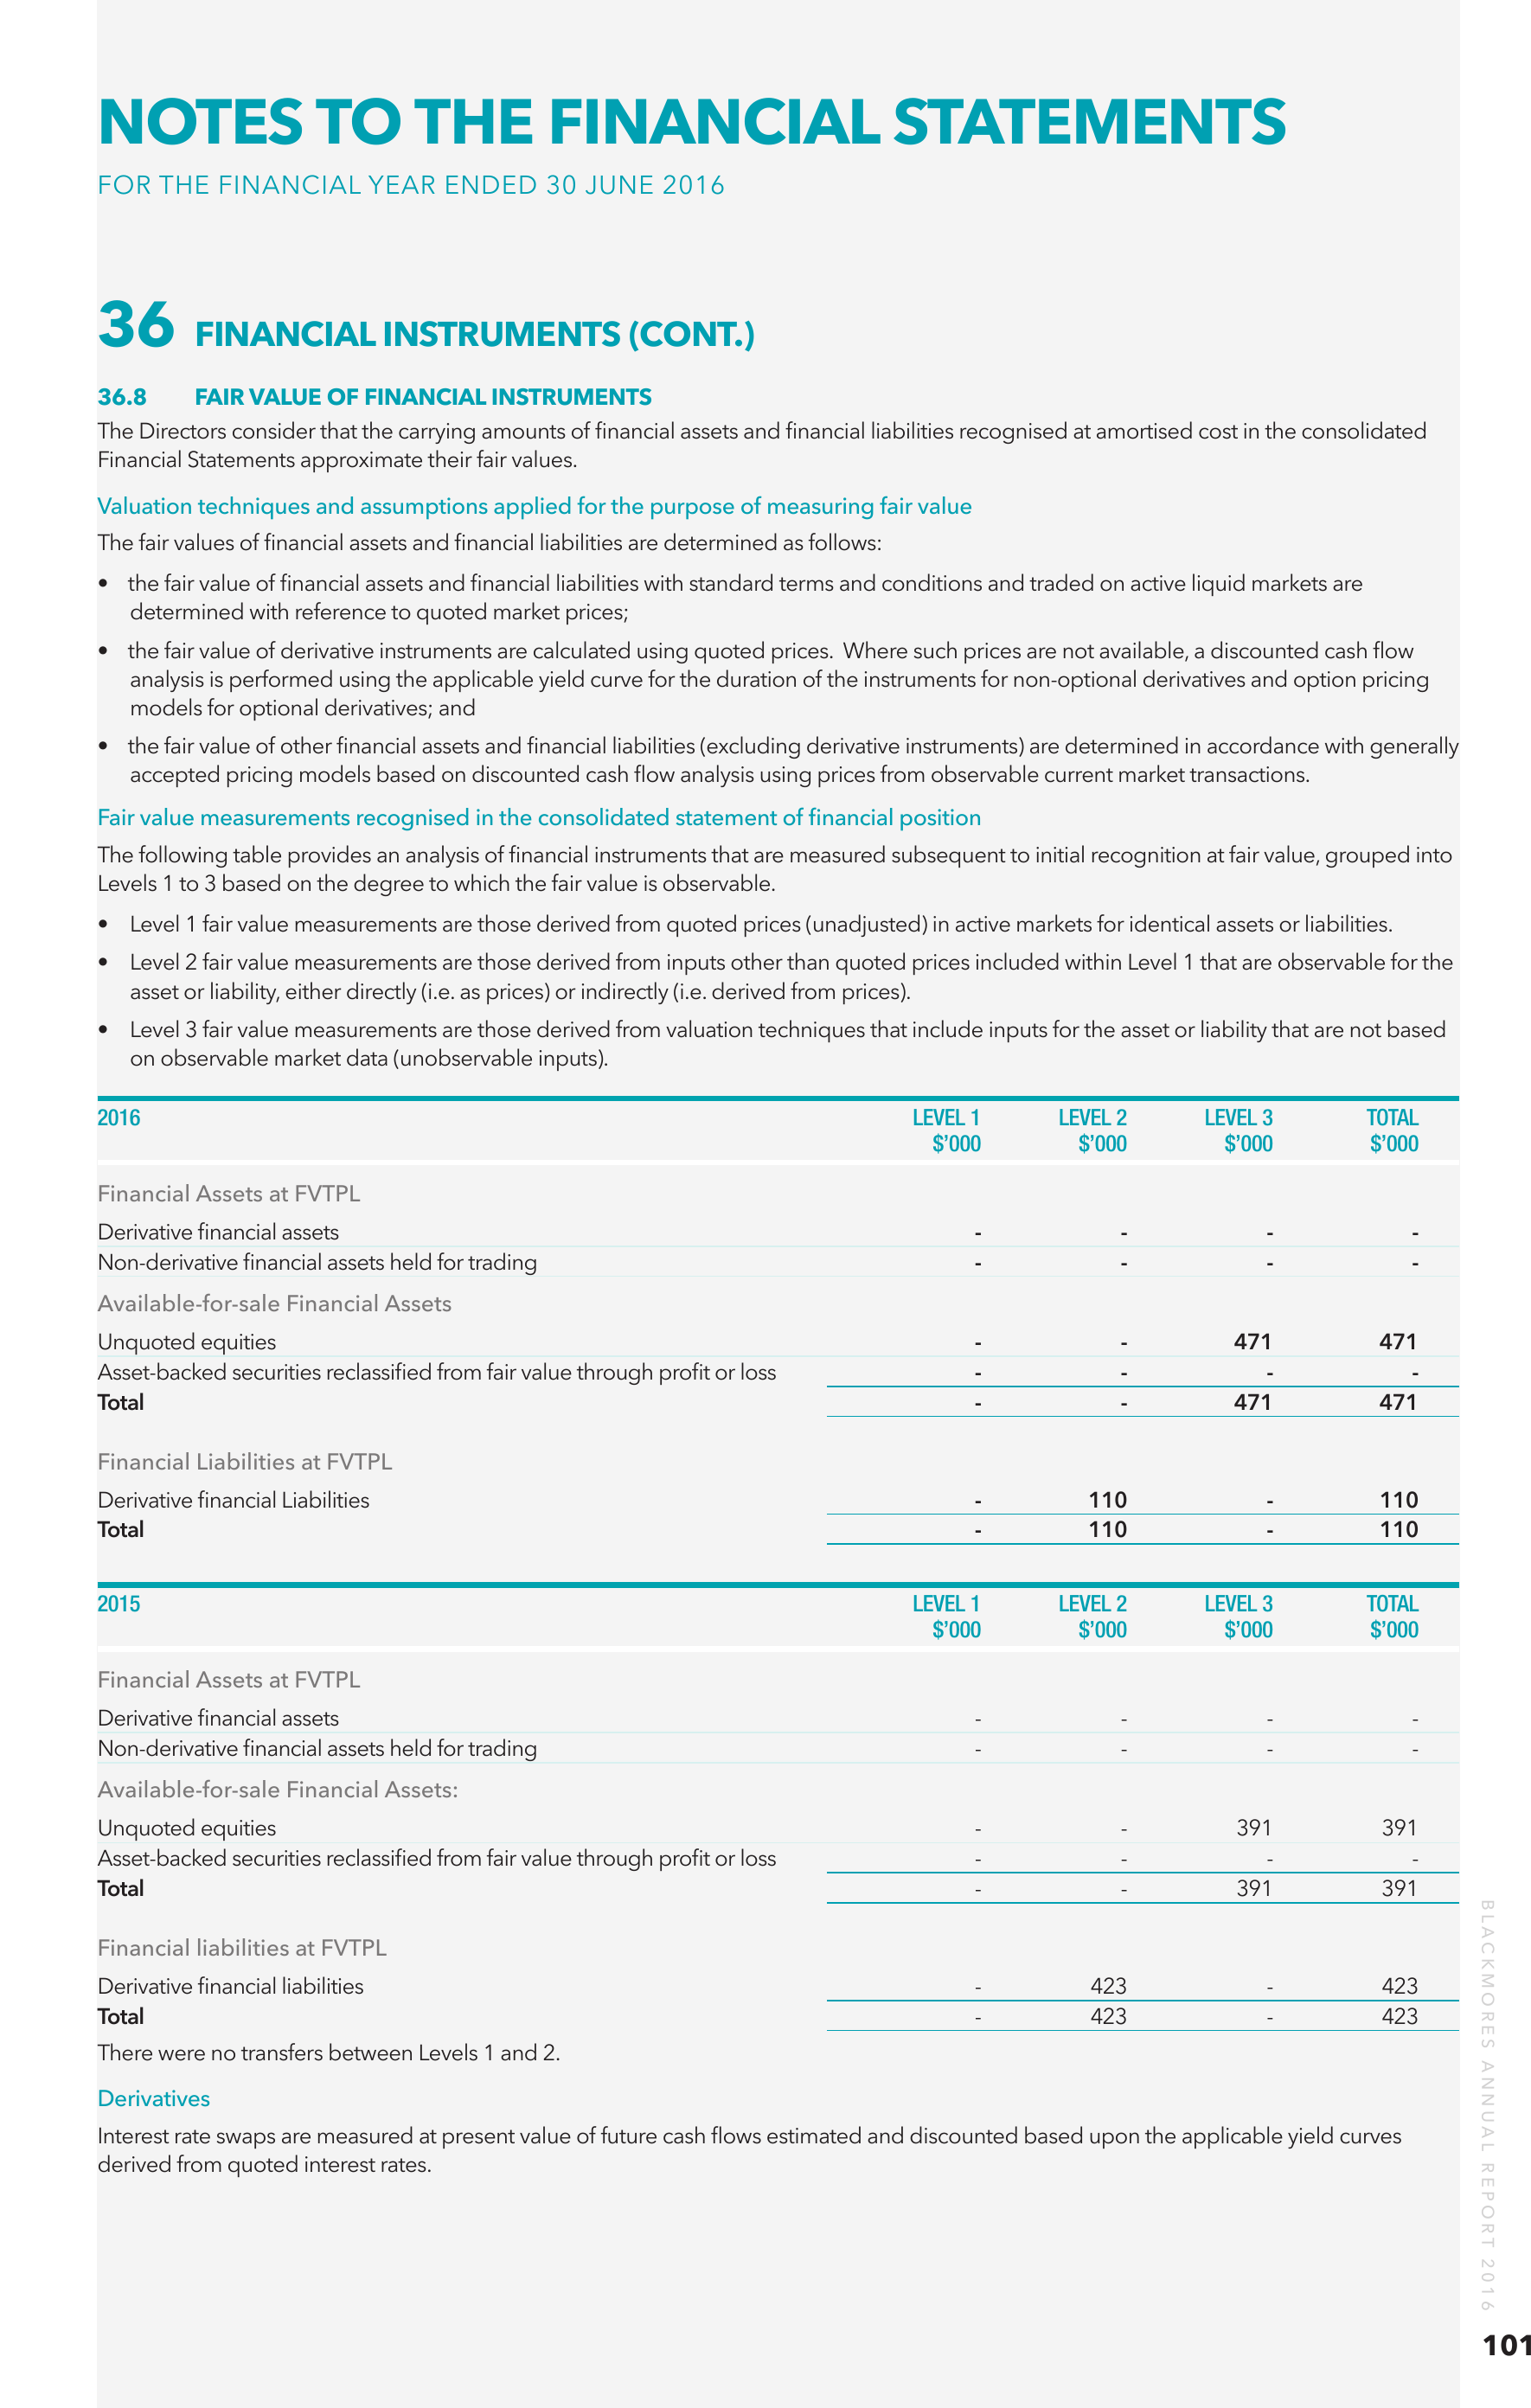
36.8
FAIR VALUE OF FINANCIAL INSTRUMENTS
The Directors consider that the carrying amounts of financial assets and financial liabilities recognised at amortised cost in the consolidated
Financial Statements approximate their fair values.
Valuation techniques and assumptions applied for the purpose of measuring fair value
The fair values of financial assets and financial liabilities are determined as follows:
• the fair value of financial assets and financial liabilities with standard terms and conditions and traded on active liquid markets are
determined with reference to quoted market prices;
• the fair value of derivative instruments are calculated using quoted prices. Where such prices are not available, a discounted cash flow
analysis is performed using the applicable yield curve for the duration of the instruments for non-optional derivatives and option pricing
models for optional derivatives; and
• the fair value of other financial assets and financial liabilities (excluding derivative instruments) are determined in accordance with generally
accepted pricing models based on discounted cash flow analysis using prices from observable current market transactions.
Fair value measurements recognised in the consolidated statement of financial position
The following table provides an analysis of financial instruments that are measured subsequent to initial recognition at fair value, grouped into
Levels 1 to 3 based on the degree to which the fair value is observable.
• Level 1 fair value measurements are those derived from quoted prices (unadjusted) in active markets for identical assets or liabilities.
• Level 2 fair value measurements are those derived from inputs other than quoted prices included within Level 1 that are observable for the
asset or liability, either directly (i.e. as prices) or indirectly (i.e. derived from prices).
• Level 3 fair value measurements are those derived from valuation techniques that include inputs for the asset or liability that are not based
on observable market data (unobservable inputs).
2016
LEVEL 1
LEVEL 2
LEVEL 3
TOTAL
$’000 $’000 $’000 $’000
Financial Assets at FVTPL
-
-
-
-
-
-
-
Unquoted equities
-
Asset-backed securities reclassified from fair value through profit or loss
-
Total
-
-
-
-
471
-
471
471
471
110
110
-
-
110
110
Derivative financial assets
Non-derivative financial assets held for trading
Available-for-sale Financial Assets
Financial Liabilities at FVTPL
Derivative financial Liabilities
-
Total
-
2015
LEVEL 1
LEVEL 2
LEVEL 3
TOTAL
$’000 $’000 $’000 $’000
Financial Assets at FVTPL
Derivative financial assets
Non-derivative financial assets held for trading
-
-
-
-
-
-
-
-
-
-
-
-
-
391
-
391
391
391
-
-
423
423
Available-for-sale Financial Assets:
Financial liabilities at FVTPL
Derivative financial liabilities
Total
-
-
423
423
There were no transfers between Levels 1 and 2.
Derivatives
Interest rate swaps are measured at present value of future cash flows estimated and discounted based upon the applicable yield curves
derived from quoted interest rates.
BLACKMORES ANNUAL REPORT 2016
Unquoted equities
Asset-backed securities reclassified from fair value through profit or loss
Total
101
NOTES TO THE FINANCIAL STATEMENTS
FOR THE FINANCIAL YEAR ENDED 30 JUNE 2016
37 ASSETS PLEDGED AS SECURITY
In accordance with the security arrangements of liabilities, as disclosed in note 21 to the Consolidated Financial Statements, all assets of the
Parent Entity have been pledged as security. The holder of the security does not have the right to sell or repledge the assets.
38 BUSINESS COMBINATIONS
38.1
SUBSIDIARIES ACQUIRED
On 10 May 2016 Blackmores Limited acquired 100% of Global Therapeutics Pty Limited and 100% of New Century Herbals Pty Limited.
38.2
CONSIDERATION TRANSFERRED
2016
$’000
Cash
Total
22,880
22,880
38.3
ASSETS ACQUIRED AND LIABILITIES ASSUMED AT THE DATE OF ACQUISITION
10 MAY 2016
Current assets
Cash and cash equivalents
219
Trade and other receivables
3,349
Inventories
3,976
Other assets
262
Non-current assets
Deferred tax assets
Plant and equipment
Intangible assets
187
209
14,460
Current liabilities
Trade and other payables
(2,642)
Tax liabilities
(12)
Provisions
(297)
19,711
38.4
GOODWILL ARISING ON ACQUISITION
38.5
NET CASH OUTFLOW ON ACQUISITION OF SUBSIDIARIES
Consideration transferred
Less: fair value of identifiable net assets acquired
Goodwill arising on acquisition
22,880
(19,711)
3,169
Consideration paid in cash
Less: cash and cash equivalent balances acquired
22,880
(219)
22,661
38.6
IMPACT OF ACQUISITION ON THE RESULTS OF THE GROUP
Included in profit for the year is $300 thousand attributable to the additional business generated by Global Therapeutics Limited. Revenue for
the year includes $3,100 thousand.
Had this business combination been effected on 1 July 2015, the revenue of the Group from continuing operations would have been $20,627
thousand and the profit for the year from continuing operations would have been $1,781 thousand. The directors of the Group consider these
‘pro-forma’ numbers to represent an approximate measure of the performance of the combined group on an annualised basis and to provide
a reference point for comparison in future periods.
BLACKMORES ANNUAL REPORT 2016
102
In determining the ‘pro-forma’ revenue and profit of the Group had Global Therapeutics been acquired at the beginning of the current year,
the directors have calculated depreciation of plant and equipment acquired on the basis of the fair values arising in the initial accounting for
the business combination rather than the carrying amounts recognised in the pre-acquisition financial statements.
2015
No subsidiaries were acquired during the financial year ended 30 June 2015.
NOTES TO THE FINANCIAL STATEMENTS
FOR THE FINANCIAL YEAR ENDED 30 JUNE 2016
39 PARENT ENTITY INFORMATION
The accounting policies of the Parent Entity, which have been applied in determining the financial information shown below, are the same as those
applied in the consolidated Financial Statements. Refer to note 2 for a summary of the significant accounting policies relating to the Group.
2016 2015
$’000 $’000
Financial position
Assets
Current assets
Non-current assets
Total assets
207,705
154,191
361,896
127,561
114,822
242,383
Liabilities
Current liabilities
Non-current liabilities
Total liabilities
160,735
61,096
221,831
138,209
1,041
139,250
Equity
Issued capital
37,753
37,753
Retained earnings
98,808
59,493
Reserves
3,504 5,887
Total equity
140,065
103,133
Financial performance
Profit for the year
Other comprehensive income
Total comprehensive income
91,164
537
91,701
57,313
(400)
56,913
Guarantees entered into by the parent entity in relation to the debts of its subsidiaries
The Company has provided Letters of Support in relation to Pat Health Ltd and Blackmores (Taiwan) Ltd, both wholly owned subsidiaries of
the Group.
The directors have a reasonable expectation that the Company will have sufficient financial accommodation to enable payment of the
subsidiaries' debts as and when they fall due for a period of at least 12 months from the date of signing the local Financial Statements of the
above mentioned entities.
Contingent liabilities
The Directors do not believe there are any contingent liabilities as at 30 June 2016 (2015: $nil).
Commitments for the acquisition of property, plant and equipment by the parent entity
Plant and equipment
Not longer than 1 year
40 EVENTS AFTER THE REPORTING PERIOD
3,906
3,906
9,800
9,800
Final dividend
The Directors declared a fully franked final dividend of 210 cents per share on 24 August 2016 as described in note 28.
41 APPROVAL OF FINANCIAL STATEMENTS
BLACKMORES ANNUAL REPORT 2016
The Consolidated Financial Statements were approved by the Board of Directors and authorised for issue on 24 August 2016.
103